Chapter Contents
Reviewing Metadata (Case: Landsat 8 Level-1 Data)
Compositing Bands (i.e. Layer Stack)
Mosaic Multiple Scenes to One Scene
After obtaining a remotely-sensed image, users often need to prepare the image for further analyses. This chapter describes some important skills to prepare images for analyses.
In this chapter, the Landsat 8 Level-1 dataset will be used as a case example. For other datasets, please refer to their metadata and the user’s guide.
Reviewing Metadata (Case: Landsat 8 Level-1 Data)
Reading the metadata information that mostly comes with an image is the first step to prepare an image. In the case of the Landsat 8 Level-1 dataset, the metadata comes in the “*_MTL.txt” file as shown in Figure 1.
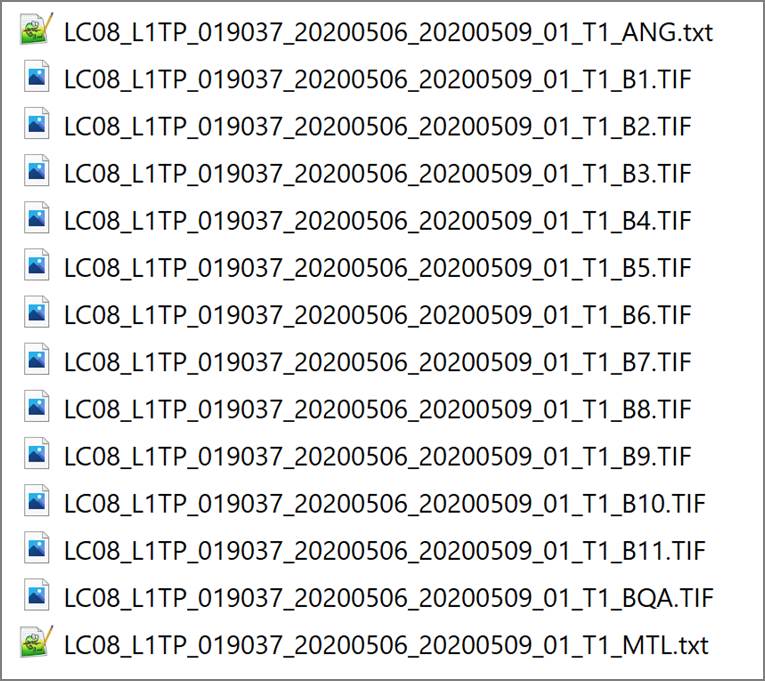
Figure 1. The files in a Landsat 8 Level-1 scene. The file at the bottom is the metadata file in the text format.
The following shows the contents of the metadata file (LC08_L1TP_019037_20200506_20200509_01_T1_MTL.txt) with some author’s annotations in the red-colored font:
|
GROUP = L1_METADATA_FILE GROUP = METADATA_FILE_INFO ORIGIN = "Image courtesy of the U.S. Geological Survey" REQUEST_ID = "0702005080457_00020" LANDSAT_SCENE_ID = "LC80190372020127LGN00" LANDSAT_PRODUCT_ID = "LC08_L1TP_019037_20200506_20200509_01_T1" COLLECTION_NUMBER = 01 FILE_DATE = 2020-05-09T20:16:55Z STATION_ID = "LGN" PROCESSING_SOFTWARE_VERSION = "LPGS_13.1.0" END_GROUP = METADATA_FILE_INFO GROUP = PRODUCT_METADATA DATA_TYPE = "L1TP" COLLECTION_CATEGORY = "T1" ELEVATION_SOURCE = "GLS2000" OUTPUT_FORMAT = "GEOTIFF" SPACECRAFT_ID = "LANDSAT_8" SENSOR_ID = "OLI_TIRS" WRS_PATH = 19 WRS_ROW = 37 NADIR_OFFNADIR = "NADIR" TARGET_WRS_PATH = 19 TARGET_WRS_ROW = 37 DATE_ACQUIRED = 2020-05-06 : The date of imaging. SCENE_CENTER_TIME = "16:12:10.4032730Z" : “Z” at the end means the Zulu (i.e. UTC) time. CORNER_UL_LAT_PRODUCT = 34.23222 CORNER_UL_LON_PRODUCT = -85.95329 CORNER_UR_LAT_PRODUCT = 34.18644 CORNER_UR_LON_PRODUCT = -83.49007 CORNER_LL_LAT_PRODUCT = 32.14351 CORNER_LL_LON_PRODUCT = -85.97784 CORNER_LR_LAT_PRODUCT = 32.10121 CORNER_LR_LON_PRODUCT = -83.57223 CORNER_UL_PROJECTION_X_PRODUCT = 596400.000 CORNER_UL_PROJECTION_Y_PRODUCT = 3788400.000 CORNER_UR_PROJECTION_X_PRODUCT = 823500.000 CORNER_UR_PROJECTION_Y_PRODUCT = 3788400.000 CORNER_LL_PROJECTION_X_PRODUCT = 596400.000 CORNER_LL_PROJECTION_Y_PRODUCT = 3556800.000 CORNER_LR_PROJECTION_X_PRODUCT = 823500.000 CORNER_LR_PROJECTION_Y_PRODUCT = 3556800.000 PANCHROMATIC_LINES = 15441 : Number of rows in the panchromatic band PANCHROMATIC_SAMPLES = 15141 : Number of columns in the panchromatic band REFLECTIVE_LINES = 7721 : Number of rows in the multispectral bands REFLECTIVE_SAMPLES = 7571 : Number of columns in the multispectral bands THERMAL_LINES = 7721 : Number of rows in the thermal band THERMAL_SAMPLES = 7571 : Number of columns in the thermal band FILE_NAME_BAND_1 = "LC08_L1TP_019037_20200506_20200509_01_T1_B1.TIF" FILE_NAME_BAND_2 = "LC08_L1TP_019037_20200506_20200509_01_T1_B2.TIF" FILE_NAME_BAND_3 = "LC08_L1TP_019037_20200506_20200509_01_T1_B3.TIF" FILE_NAME_BAND_4 = "LC08_L1TP_019037_20200506_20200509_01_T1_B4.TIF" FILE_NAME_BAND_5 = "LC08_L1TP_019037_20200506_20200509_01_T1_B5.TIF" FILE_NAME_BAND_6 = "LC08_L1TP_019037_20200506_20200509_01_T1_B6.TIF" FILE_NAME_BAND_7 = "LC08_L1TP_019037_20200506_20200509_01_T1_B7.TIF" FILE_NAME_BAND_8 = "LC08_L1TP_019037_20200506_20200509_01_T1_B8.TIF" FILE_NAME_BAND_9 = "LC08_L1TP_019037_20200506_20200509_01_T1_B9.TIF" FILE_NAME_BAND_10 = "LC08_L1TP_019037_20200506_20200509_01_T1_B10.TIF" FILE_NAME_BAND_11 = "LC08_L1TP_019037_20200506_20200509_01_T1_B11.TIF" FILE_NAME_BAND_QUALITY = "LC08_L1TP_019037_20200506_20200509_01_T1_BQA.TIF" ANGLE_COEFFICIENT_FILE_NAME = "LC08_L1TP_019037_20200506_20200509_01_T1_ANG.txt" METADATA_FILE_NAME = "LC08_L1TP_019037_20200506_20200509_01_T1_MTL.txt" CPF_NAME = "LC08CPF_20200401_20200630_01.01" BPF_NAME_OLI = "LO8BPF20200506155114_20200506162152.01" BPF_NAME_TIRS = "LT8BPF20200419000412_20200507172808.01" RLUT_FILE_NAME = "LC08RLUT_20150303_20431231_01_12.h5" END_GROUP = PRODUCT_METADATA GROUP = IMAGE_ATTRIBUTES CLOUD_COVER = 0.63 : Percent cloud cover in the 0 – 100 range. The value 0.63 means quite cloud-free. CLOUD_COVER_LAND = 0.63 IMAGE_QUALITY_OLI = 9 IMAGE_QUALITY_TIRS = 9 TIRS_SSM_MODEL = "FINAL" TIRS_SSM_POSITION_STATUS = "ESTIMATED" TIRS_STRAY_LIGHT_CORRECTION_SOURCE = "TIRS" ROLL_ANGLE = -0.001 SUN_AZIMUTH = 126.01685687 : Direction to the Sun. Zero (0) to the north, and clockwise increase. The sun is at SE. SUN_ELEVATION = 65.08004180 : The angle from the horizon to the Sun. EARTH_SUN_DISTANCE = 1.0089718 SATURATION_BAND_1 = "Y" SATURATION_BAND_2 = "Y" SATURATION_BAND_3 = "Y" SATURATION_BAND_4 = "Y" SATURATION_BAND_5 = "Y" SATURATION_BAND_6 = "Y" SATURATION_BAND_7 = "Y" SATURATION_BAND_8 = "N" SATURATION_BAND_9 = "N" GROUND_CONTROL_POINTS_VERSION = 4 GROUND_CONTROL_POINTS_MODEL = 461 GEOMETRIC_RMSE_MODEL = 6.772 GEOMETRIC_RMSE_MODEL_Y = 4.729 GEOMETRIC_RMSE_MODEL_X = 4.848 GROUND_CONTROL_POINTS_VERIFY = 201 GEOMETRIC_RMSE_VERIFY = 4.323 TRUNCATION_OLI = "UPPER" END_GROUP = IMAGE_ATTRIBUTES GROUP = MIN_MAX_RADIANCE RADIANCE_MAXIMUM_BAND_1 = 746.60583 RADIANCE_MINIMUM_BAND_1 = -61.65495 RADIANCE_MAXIMUM_BAND_2 = 764.53345 RADIANCE_MINIMUM_BAND_2 = -63.13542 RADIANCE_MAXIMUM_BAND_3 = 704.51105 RADIANCE_MINIMUM_BAND_3 = -58.17875 RADIANCE_MAXIMUM_BAND_4 = 594.08344 RADIANCE_MINIMUM_BAND_4 = -49.05960 RADIANCE_MAXIMUM_BAND_5 = 363.54944 RADIANCE_MINIMUM_BAND_5 = -30.02203 RADIANCE_MAXIMUM_BAND_6 = 90.41144 RADIANCE_MINIMUM_BAND_6 = -7.46621 RADIANCE_MAXIMUM_BAND_7 = 30.47349 RADIANCE_MINIMUM_BAND_7 = -2.51651 RADIANCE_MAXIMUM_BAND_8 = 672.33893 RADIANCE_MINIMUM_BAND_8 = -55.52197 RADIANCE_MAXIMUM_BAND_9 = 142.08336 RADIANCE_MINIMUM_BAND_9 = -11.73329 RADIANCE_MAXIMUM_BAND_10 = 22.00180 RADIANCE_MINIMUM_BAND_10 = 0.10033 RADIANCE_MAXIMUM_BAND_11 = 22.00180 RADIANCE_MINIMUM_BAND_11 = 0.10033 END_GROUP = MIN_MAX_RADIANCE GROUP = MIN_MAX_REFLECTANCE REFLECTANCE_MAXIMUM_BAND_1 = 1.210700 REFLECTANCE_MINIMUM_BAND_1 = -0.099980 REFLECTANCE_MAXIMUM_BAND_2 = 1.210700 REFLECTANCE_MINIMUM_BAND_2 = -0.099980 REFLECTANCE_MAXIMUM_BAND_3 = 1.210700 REFLECTANCE_MINIMUM_BAND_3 = -0.099980 REFLECTANCE_MAXIMUM_BAND_4 = 1.210700 REFLECTANCE_MINIMUM_BAND_4 = -0.099980 REFLECTANCE_MAXIMUM_BAND_5 = 1.210700 REFLECTANCE_MINIMUM_BAND_5 = -0.099980 REFLECTANCE_MAXIMUM_BAND_6 = 1.210700 REFLECTANCE_MINIMUM_BAND_6 = -0.099980 REFLECTANCE_MAXIMUM_BAND_7 = 1.210700 REFLECTANCE_MINIMUM_BAND_7 = -0.099980 REFLECTANCE_MAXIMUM_BAND_8 = 1.210700 REFLECTANCE_MINIMUM_BAND_8 = -0.099980 REFLECTANCE_MAXIMUM_BAND_9 = 1.210700 REFLECTANCE_MINIMUM_BAND_9 = -0.099980 END_GROUP = MIN_MAX_REFLECTANCE GROUP = MIN_MAX_PIXEL_VALUE QUANTIZE_CAL_MAX_BAND_1 = 65535 QUANTIZE_CAL_MIN_BAND_1 = 1 QUANTIZE_CAL_MAX_BAND_2 = 65535 QUANTIZE_CAL_MIN_BAND_2 = 1 QUANTIZE_CAL_MAX_BAND_3 = 65535 QUANTIZE_CAL_MIN_BAND_3 = 1 QUANTIZE_CAL_MAX_BAND_4 = 65535 QUANTIZE_CAL_MIN_BAND_4 = 1 QUANTIZE_CAL_MAX_BAND_5 = 65535 QUANTIZE_CAL_MIN_BAND_5 = 1 QUANTIZE_CAL_MAX_BAND_6 = 65535 QUANTIZE_CAL_MIN_BAND_6 = 1 QUANTIZE_CAL_MAX_BAND_7 = 65535 QUANTIZE_CAL_MIN_BAND_7 = 1 QUANTIZE_CAL_MAX_BAND_8 = 65535 QUANTIZE_CAL_MIN_BAND_8 = 1 QUANTIZE_CAL_MAX_BAND_9 = 65535 QUANTIZE_CAL_MIN_BAND_9 = 1 QUANTIZE_CAL_MAX_BAND_10 = 65535 QUANTIZE_CAL_MIN_BAND_10 = 1 QUANTIZE_CAL_MAX_BAND_11 = 65535 QUANTIZE_CAL_MIN_BAND_11 = 1 END_GROUP = MIN_MAX_PIXEL_VALUE GROUP = RADIOMETRIC_RESCALING RADIANCE_MULT_BAND_1 = 1.2333E-02 RADIANCE_MULT_BAND_2 = 1.2630E-02 RADIANCE_MULT_BAND_3 = 1.1638E-02 RADIANCE_MULT_BAND_4 = 9.8139E-03 RADIANCE_MULT_BAND_5 = 6.0056E-03 RADIANCE_MULT_BAND_6 = 1.4935E-03 RADIANCE_MULT_BAND_7 = 5.0340E-04 RADIANCE_MULT_BAND_8 = 1.1107E-02 RADIANCE_MULT_BAND_9 = 2.3471E-03 RADIANCE_MULT_BAND_10 = 3.3420E-04 RADIANCE_MULT_BAND_11 = 3.3420E-04 RADIANCE_ADD_BAND_1 = -61.66729 RADIANCE_ADD_BAND_2 = -63.14805 RADIANCE_ADD_BAND_3 = -58.19039 RADIANCE_ADD_BAND_4 = -49.06942 RADIANCE_ADD_BAND_5 = -30.02804 RADIANCE_ADD_BAND_6 = -7.46770 RADIANCE_ADD_BAND_7 = -2.51701 RADIANCE_ADD_BAND_8 = -55.53307 RADIANCE_ADD_BAND_9 = -11.73564 RADIANCE_ADD_BAND_10 = 0.10000 RADIANCE_ADD_BAND_11 = 0.10000 REFLECTANCE_MULT_BAND_1 = 2.0000E-05 REFLECTANCE_MULT_BAND_2 = 2.0000E-05 REFLECTANCE_MULT_BAND_3 = 2.0000E-05 REFLECTANCE_MULT_BAND_4 = 2.0000E-05 REFLECTANCE_MULT_BAND_5 = 2.0000E-05 REFLECTANCE_MULT_BAND_6 = 2.0000E-05 REFLECTANCE_MULT_BAND_7 = 2.0000E-05 REFLECTANCE_MULT_BAND_8 = 2.0000E-05 REFLECTANCE_MULT_BAND_9 = 2.0000E-05 REFLECTANCE_ADD_BAND_1 = -0.100000 REFLECTANCE_ADD_BAND_2 = -0.100000 REFLECTANCE_ADD_BAND_3 = -0.100000 REFLECTANCE_ADD_BAND_4 = -0.100000 REFLECTANCE_ADD_BAND_5 = -0.100000 REFLECTANCE_ADD_BAND_6 = -0.100000 REFLECTANCE_ADD_BAND_7 = -0.100000 REFLECTANCE_ADD_BAND_8 = -0.100000 REFLECTANCE_ADD_BAND_9 = -0.100000 END_GROUP = RADIOMETRIC_RESCALING GROUP = TIRS_THERMAL_CONSTANTS K1_CONSTANT_BAND_10 = 774.8853 K2_CONSTANT_BAND_10 = 1321.0789 K1_CONSTANT_BAND_11 = 480.8883 K2_CONSTANT_BAND_11 = 1201.1442 END_GROUP = TIRS_THERMAL_CONSTANTS GROUP = PROJECTION_PARAMETERS MAP_PROJECTION = "UTM" : The UTM projection is used. DATUM = "WGS84" : WGS 84 datum is used. ELLIPSOID = "WGS84" : WGS 84 ellipsoid is used UTM_ZONE = 16 GRID_CELL_SIZE_PANCHROMATIC = 15.00 : The pixel size of the panchromatic bands. 15 m GRID_CELL_SIZE_REFLECTIVE = 30.00 : The pixel size of the multispectral bands. 30 m GRID_CELL_SIZE_THERMAL = 30.00 : The pixel size of the thermal bands. 30 m ORIENTATION = "NORTH_UP" RESAMPLING_OPTION = "CUBIC_CONVOLUTION" END_GROUP = PROJECTION_PARAMETERS END_GROUP = L1_METADATA_FILE END |
The scene covers the west side of Atlanta, GA. The image was taken on 5/6/2020 which was during the daylight savings period (i.e. 3/8/2020 – 11/1/2020). Considering that the Eastern Standard Time zone is four (4) hours behind the Zulu (UTC) time in May 2020, the image was taken at the EST local time of 12:12:10.4032730 pm in Atlanta, Georgia.
Converting Pixel Values
Understanding what pixel values mean in an image is very important for performing scientific analyses with the image. In the case of Landsat 8 (Level 1) data, the meaning of pixel values is well defined in the Landsat 8 (L8) Data Users Handbook (USGS, 2019). The Landsat 8 Level-1 data are delivered to users using the 16-bit integer values.
Figure 2 shows the pixel values of red, green, and blue bands of a Landsat 8 Level-1 image, and they (i.e. 15385, 14388, and 13745) do not use any physically meaningful units. The pixel values are also called digital numbers (DN).
A simple visual analysis may not need to convert the pixel values. However, scientifically meaningful parameters such as at-sensor spectral radiance, top of atmosphere reflectance, and top of atmosphere brightness temperature can be obtained by converting the pixel values.
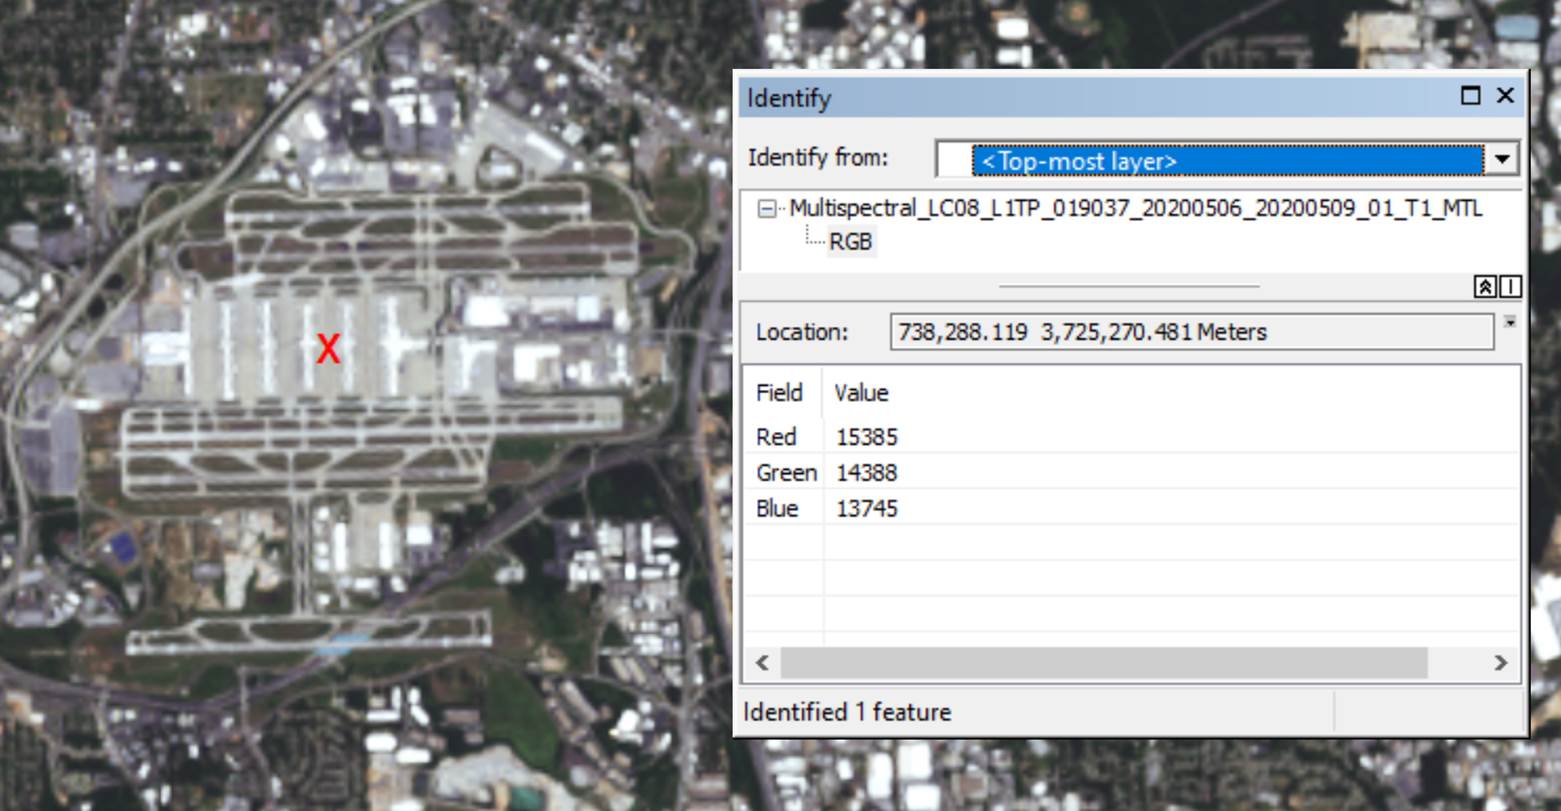
Figure 2. The pixel values of a point in the Atlanta Hartsfield International Airport.
OLI and TIRS at Sensor Spectral Radiance
The at-sensor spectral radiance is calculated using the following equation (USGS, 2019):
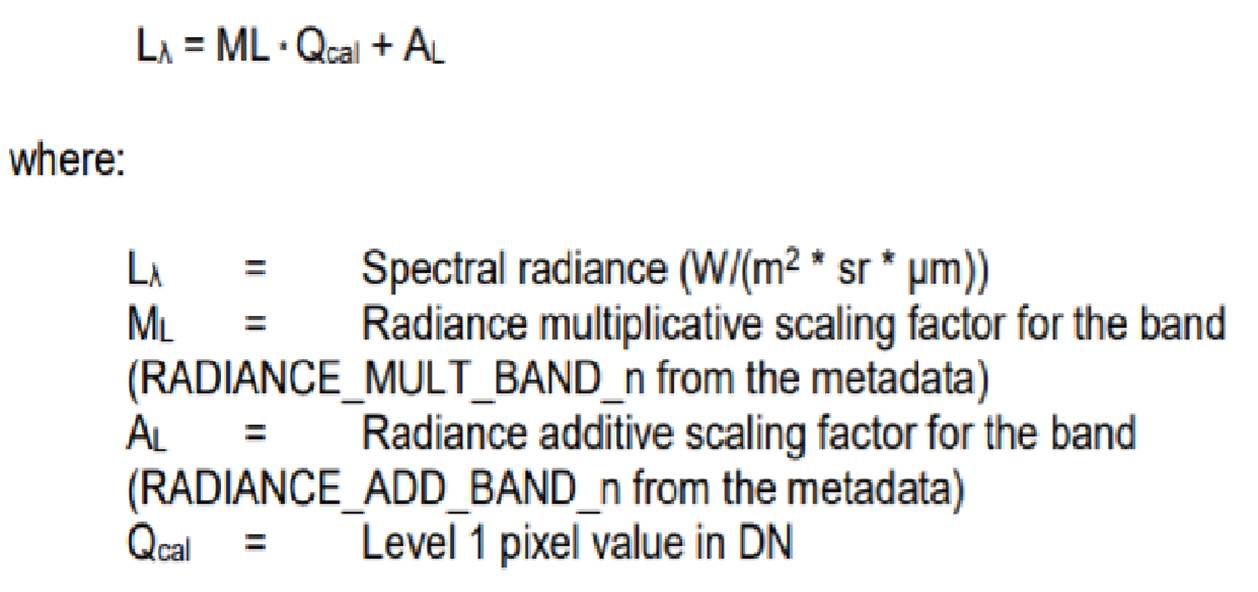
(Eq. 1)
For example, the sample pixel value of 15385 (red band = Band 4) in Figure 2 can be converted to the at-sensor spectral radiance as follows:
Qcal = 15385
ML = 9.8139E-03 : Obtained from the metadata. 9.8139E-03 = 0.0098139
AL = -49.06942 : Obtained from the metadata
at sensor spectral radiance = 0.0098139 x 15385 - 49.06942
= 101.9174315 W/(m2 ž sr ž μm)
Top of Atmosphere (TOA) Reflectance
The OLI-band pixel values (i.e. Bands 1-9) can be converted to the top of atmosphere reflectance using the following equation (USG, 2019):
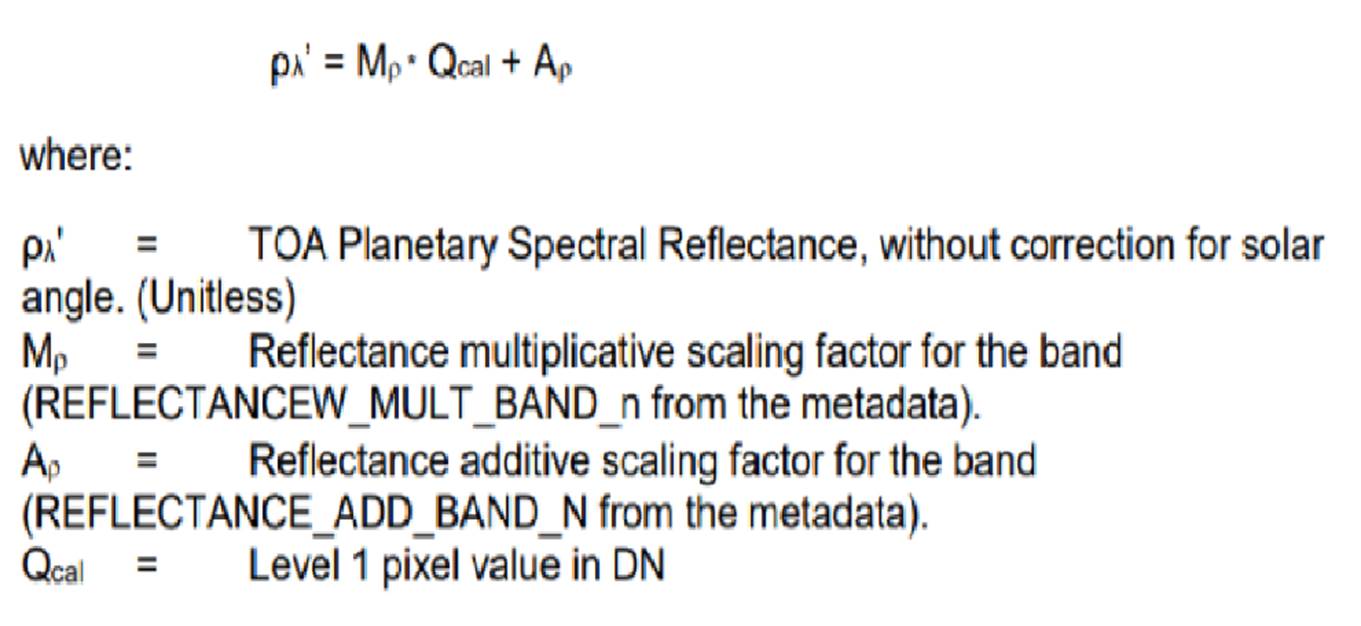
(Eq. 2)
For example, the sample pixel value of 15385 (red band = Band 4) in Figure 2 can be converted to the top of atmosphere reflectance as follows:
Mρ = 2.0000E-05 (from the metadata)
= 0.00002
QCAL = 15385
Aρ = -0.100000
Top of atmosphere reflectance (ρλ') = 0.00002 x 15385 - 0.1
= 0.2077
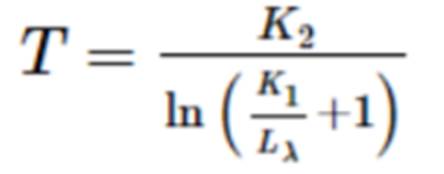
Note that ρλ' is not true TOA Reflectance, because it does not contain a correction for the solar elevation angle. The conversion to the true TOA reflectance is calculated using the following equation:
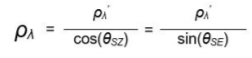
Where:
(Eq. 3)
In our example,
ρλ' = 0.2077
ϴSE = 65.08004180, from the metadata
True TOA Reflectance (Ρλ) = 0.2077 / sin(65.08004180)
= 0.2290
TIRS Top of Atmosphere Brightness Temperature
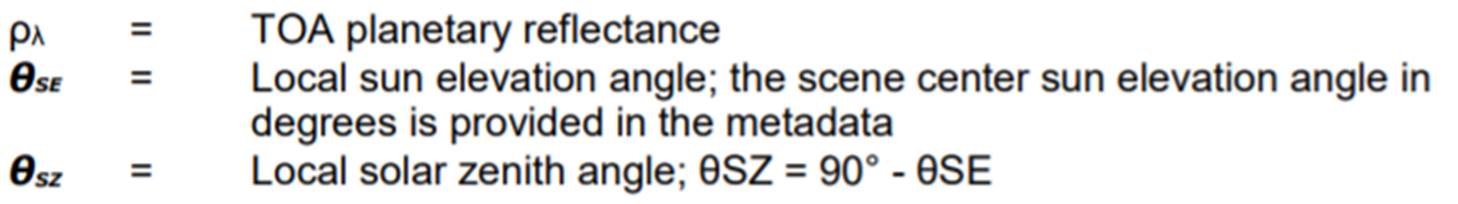
The TIRS (Thermal Infrared Sensor) band pixel values (i.e. Bands 10-11) can be converted to the Top of Atmosphere Brightness Temperature using the following equation:
Where:
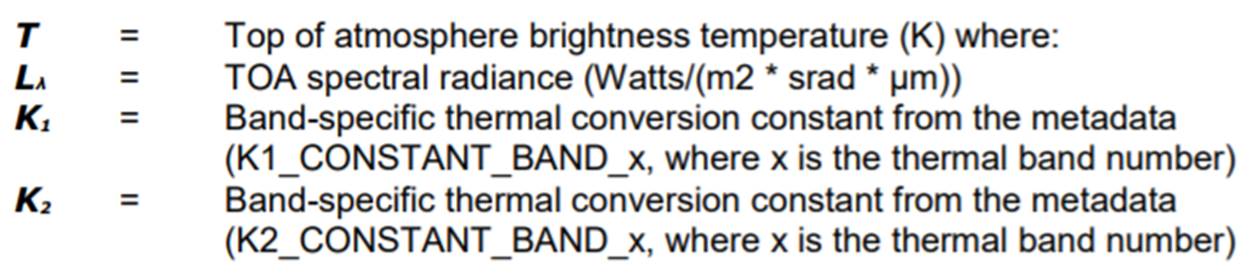
(Eq. 4)
For example, when the Band 10 pixel value of the airport sample point was browsed in a GIS system, it was 30605 as shown below.
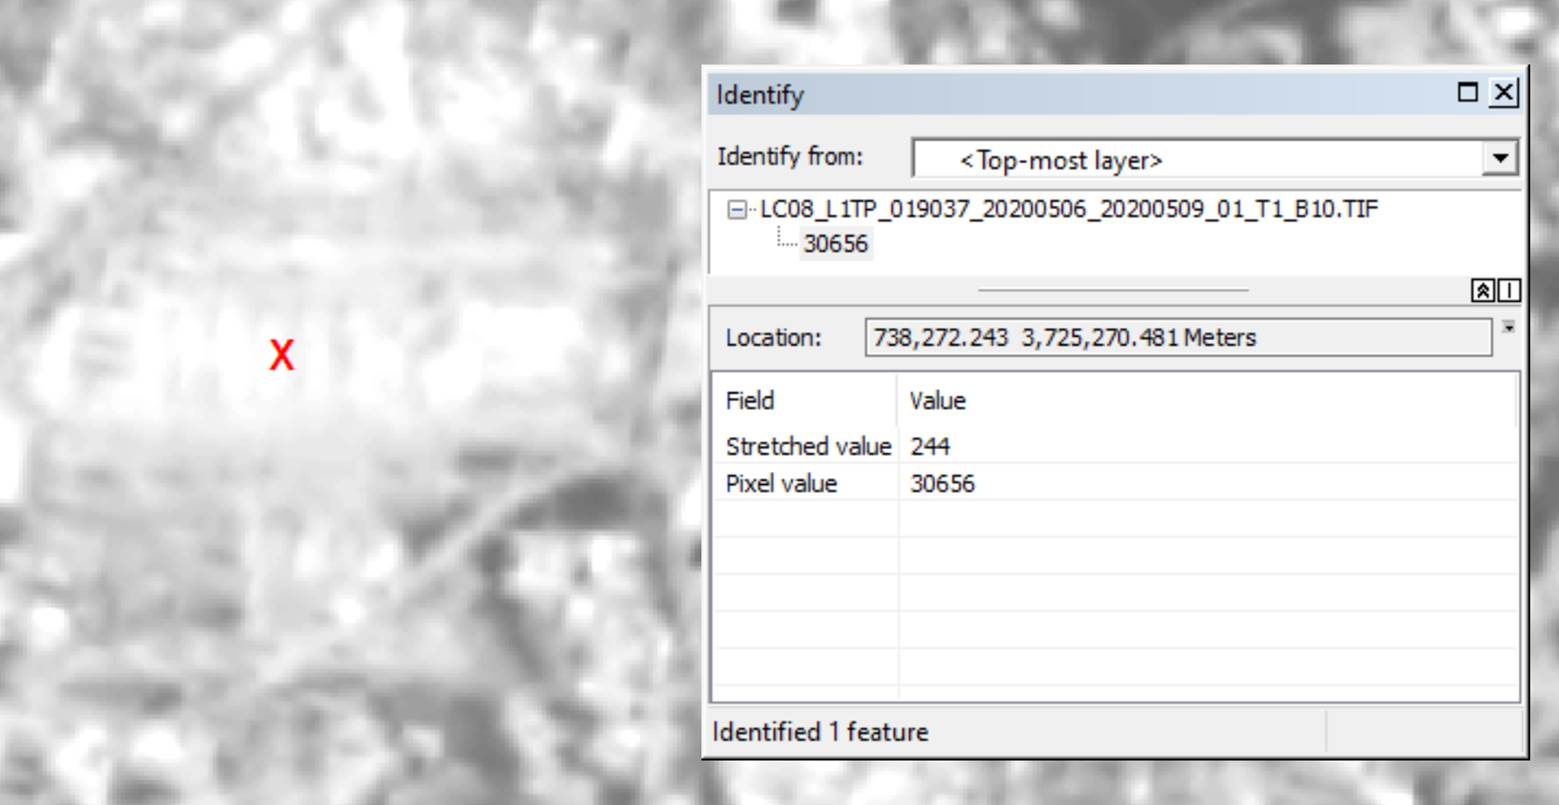
Figure 3. A sample pixel value of Band 10
First, we need to calculate the at sensor spectral radiance of the sample point using (Eq. 1):
Lλ = 0.0003342 x 30656 + 0.1
= 1.124524
Second, the TOA brightness temperature can be calculated as follows:
K2 = 1321.0789, from the metadata
K1 = 774.8853, from the metadata
T = 1321.0789 / ln( 774.8853 / 1.124524 + 1)
= 202.0986 oK
At Sensor and TOA
The radiance, reflectance and temperature at the surface of the sample point are most likely different from the values measured using the above equations. The term “at-sensor” or “top of atmosphere” was used because the actual land surface radiance, reflectance, and temperature are also significantly affected by the atmosphere like emissivity of land cover and condition of the atmosphere.
Landsat Analysis Ready Data (ARD)
Processing Landsat Level-1 data using Equations 1-4 may be burdensome to many users. Using the Landsat Analysis Ready (ARD) products will lift the burden because they are pre-processed. As of September 2020, the USGS ARD products include the following layers:
· Top of atmosphere (TOA) reflectance
· TOA Brightness temperature (BT)
· Surface Reflectance (SR)
· Provisional Surface Temperature
· Quality Assessment (QA)
· Full resolution browse image (.jpg)
· Metadata (.xml)
Compositing Bands (i.e. Layer Stack)
As shown in Figure 1 bands come in individual files. They need to be stacked into one image file for further analyses that use multiple bands as input. One example of such analyses is image classification using multiple bands.
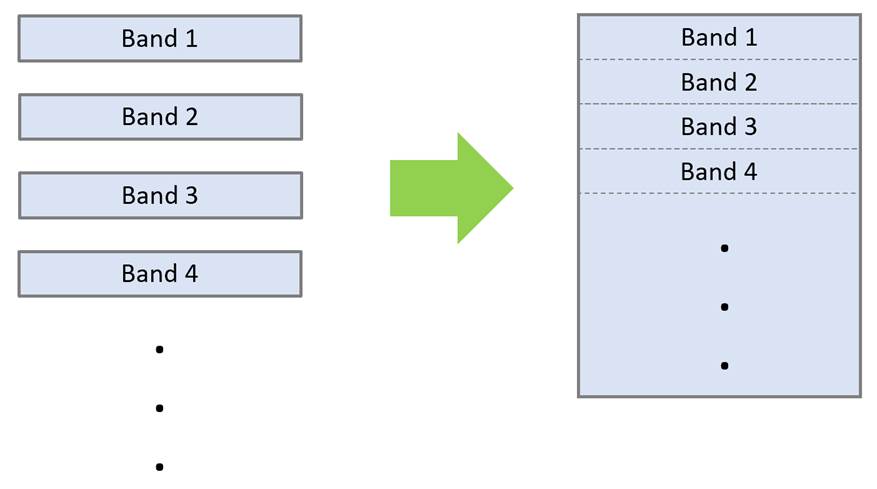
Figure 4. Compositing bands into one file.
ArcMap (https://esri.com) users may composite bands using the “Composite Bands” tool. The tool is available in ArcToolbox (Data Management Tools à Raster à Raster Processing à Composite Bands).
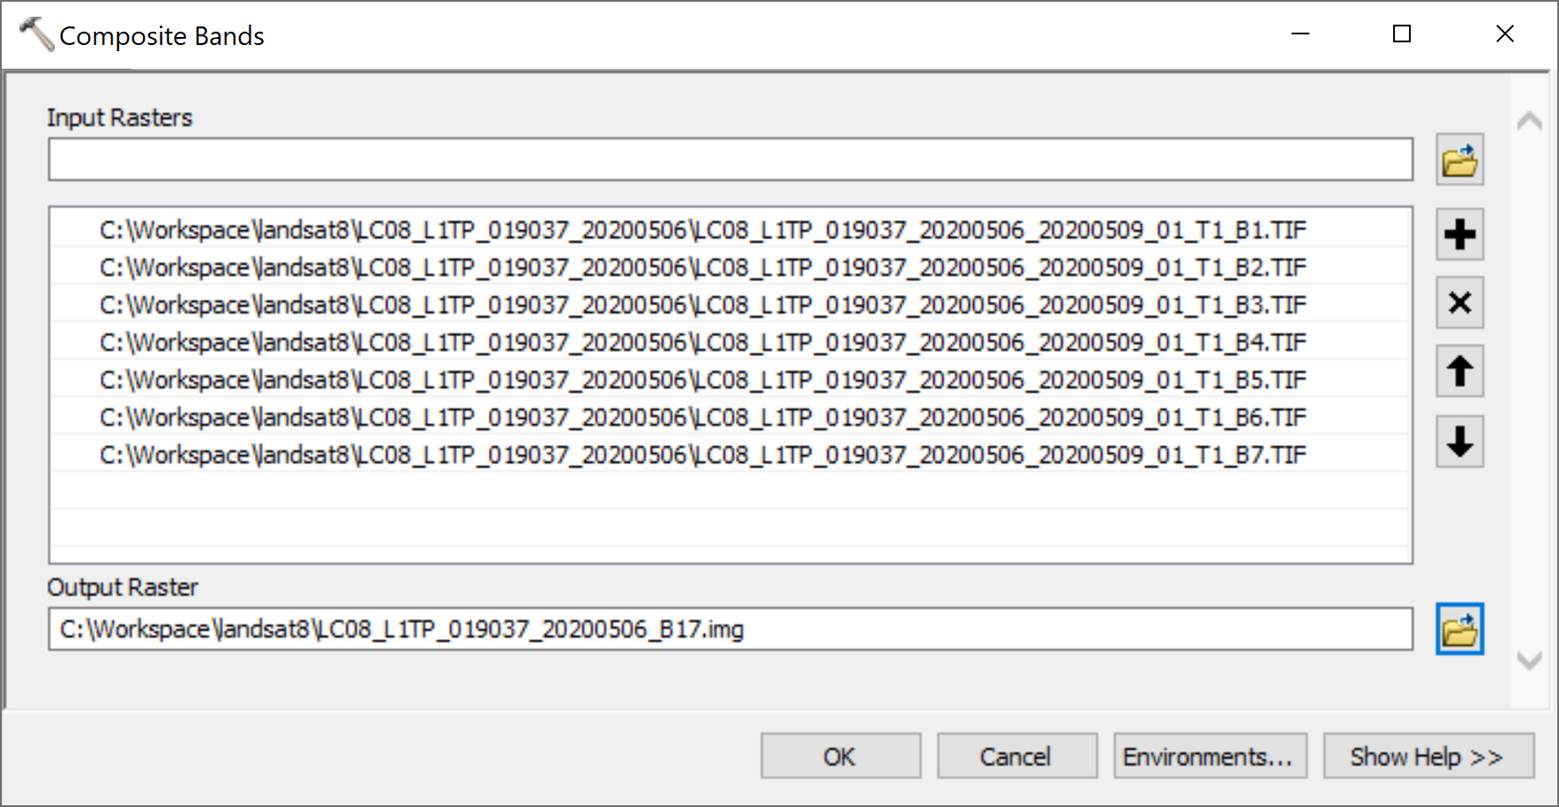
Figure 5. The Composite Bands tool in ArcMap (Version 10.7.1)
QGIS (https://qgis.org) users can composite multiple bands using the Virtual Raster tool (Raster à Misc. à Build Virtual Raster). The VRT file is a metafile about image files. When hundreds or thousands of image files are composited, the VRT file format can be an effective option because it does not create an extremely voluminous file.
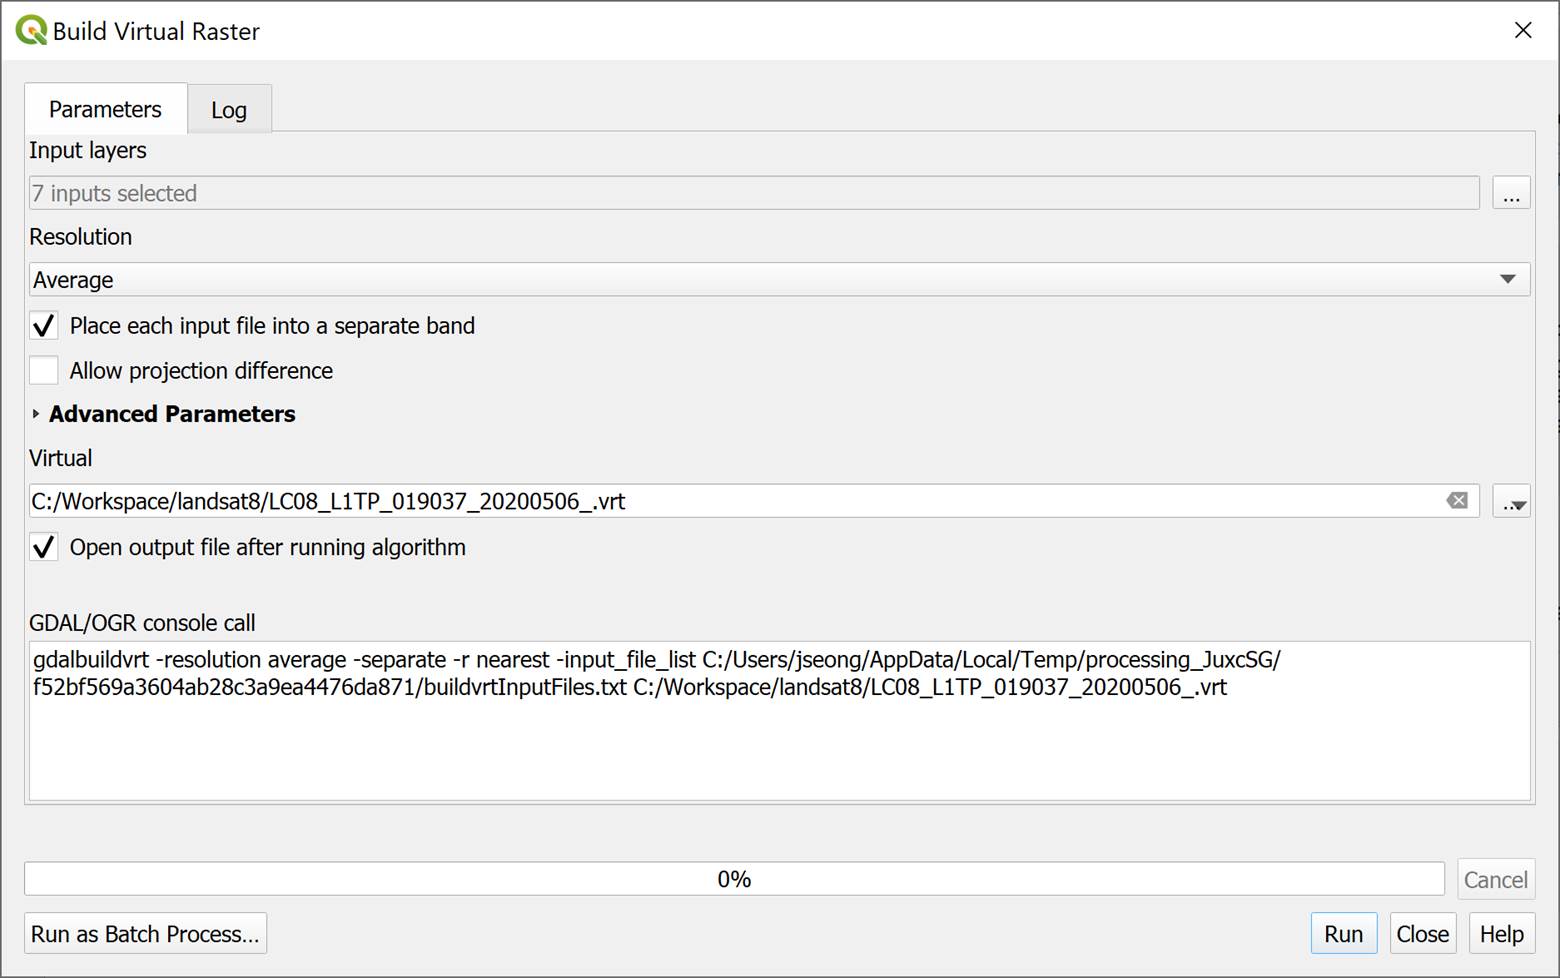
Figure 6. Compositing bands using the Build Virtual Raster tool in QGIS.
Mosaic Multiple Scenes to One Scene
A study area may be covered by multiple scenes. In that case, they may need to be mosaiced to one scene. Figure 7 shows two scenes (Row 36 and Row 37) in Path 16. When two scenes are mosaicked, the no-data pixels that appear in black causes a problem when one scene simply covers the other scene. Most times, using the “Maximum” option for the overlapping area resolves the problem because the no-data pixel values are relatively very small. Figure 8 shows the “Maximum” option in the ArcMap’s “Mosaic to New Raster” tool. In Figure 8, the 16_Bit_Unsigned integer was chosen because the original pixel values are in the 16-bit integer. The number of bands was set to 7 because seven bands were composited with the “Composite Bands” tool. And, finally, the “Maximum” option was selected as the mosaic operator.
If pixel values were converted to radiance, reflectance, or temperature as described in the previous section, the output pixel type should be a real number type like 32_bit float, or 64-bit double.
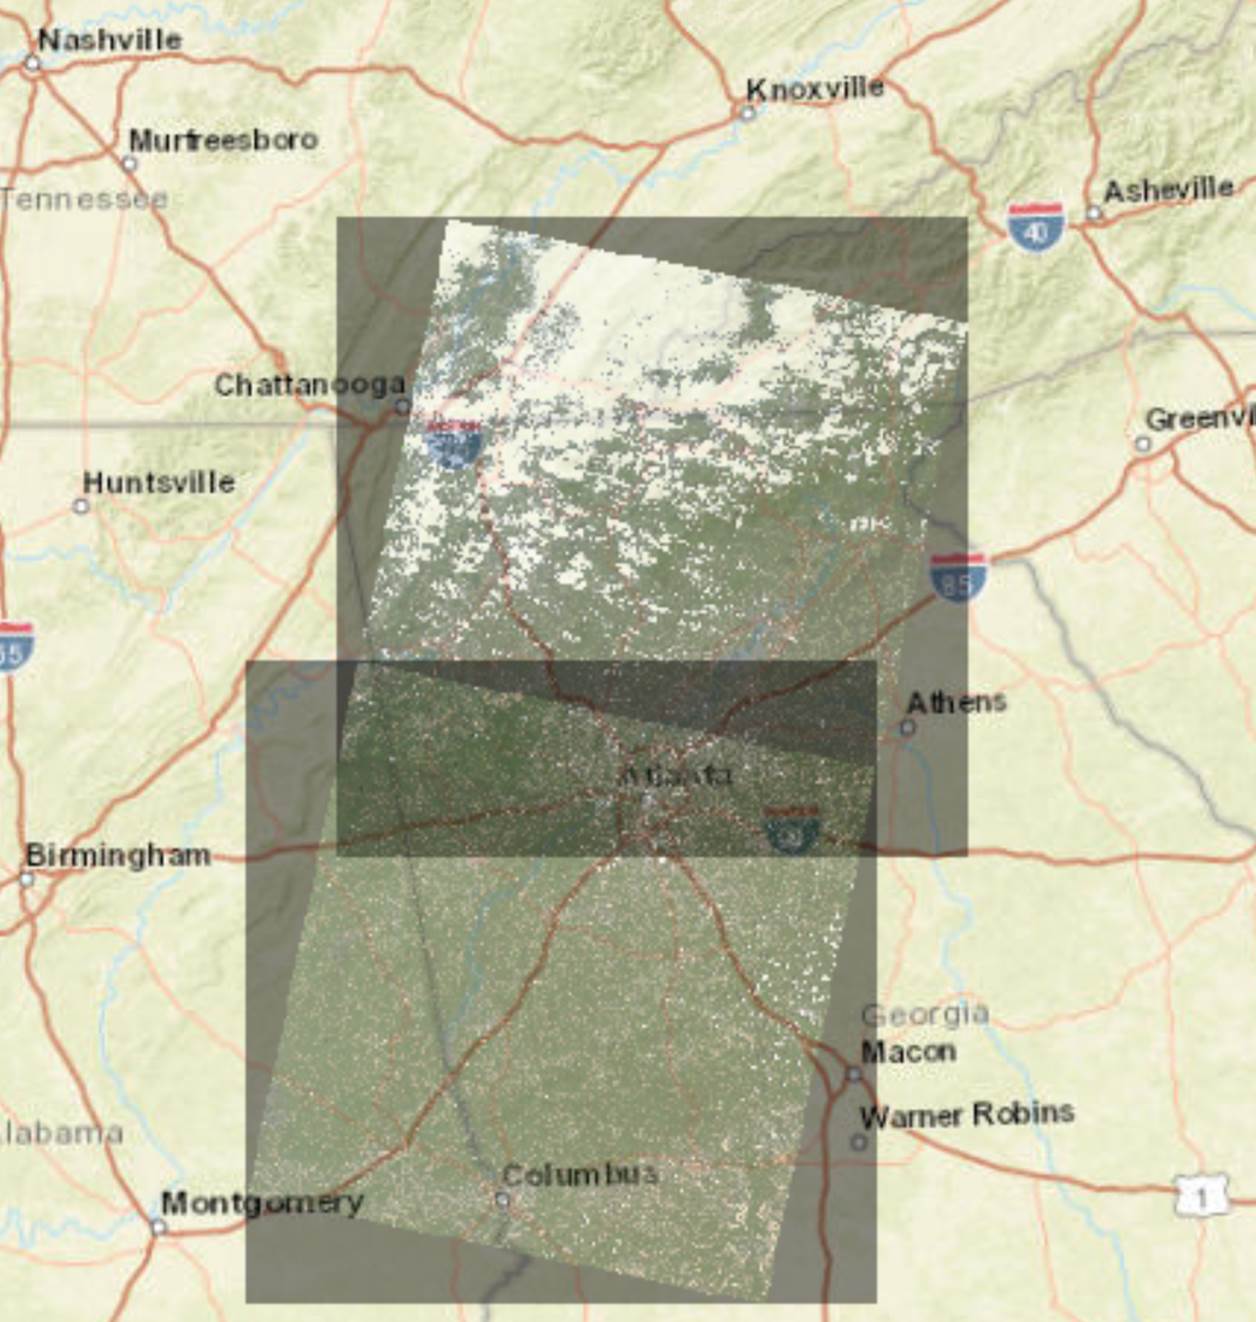
Figure 7. Two neighboring Landsat 8 Level-1 scenes with no-data pixels.
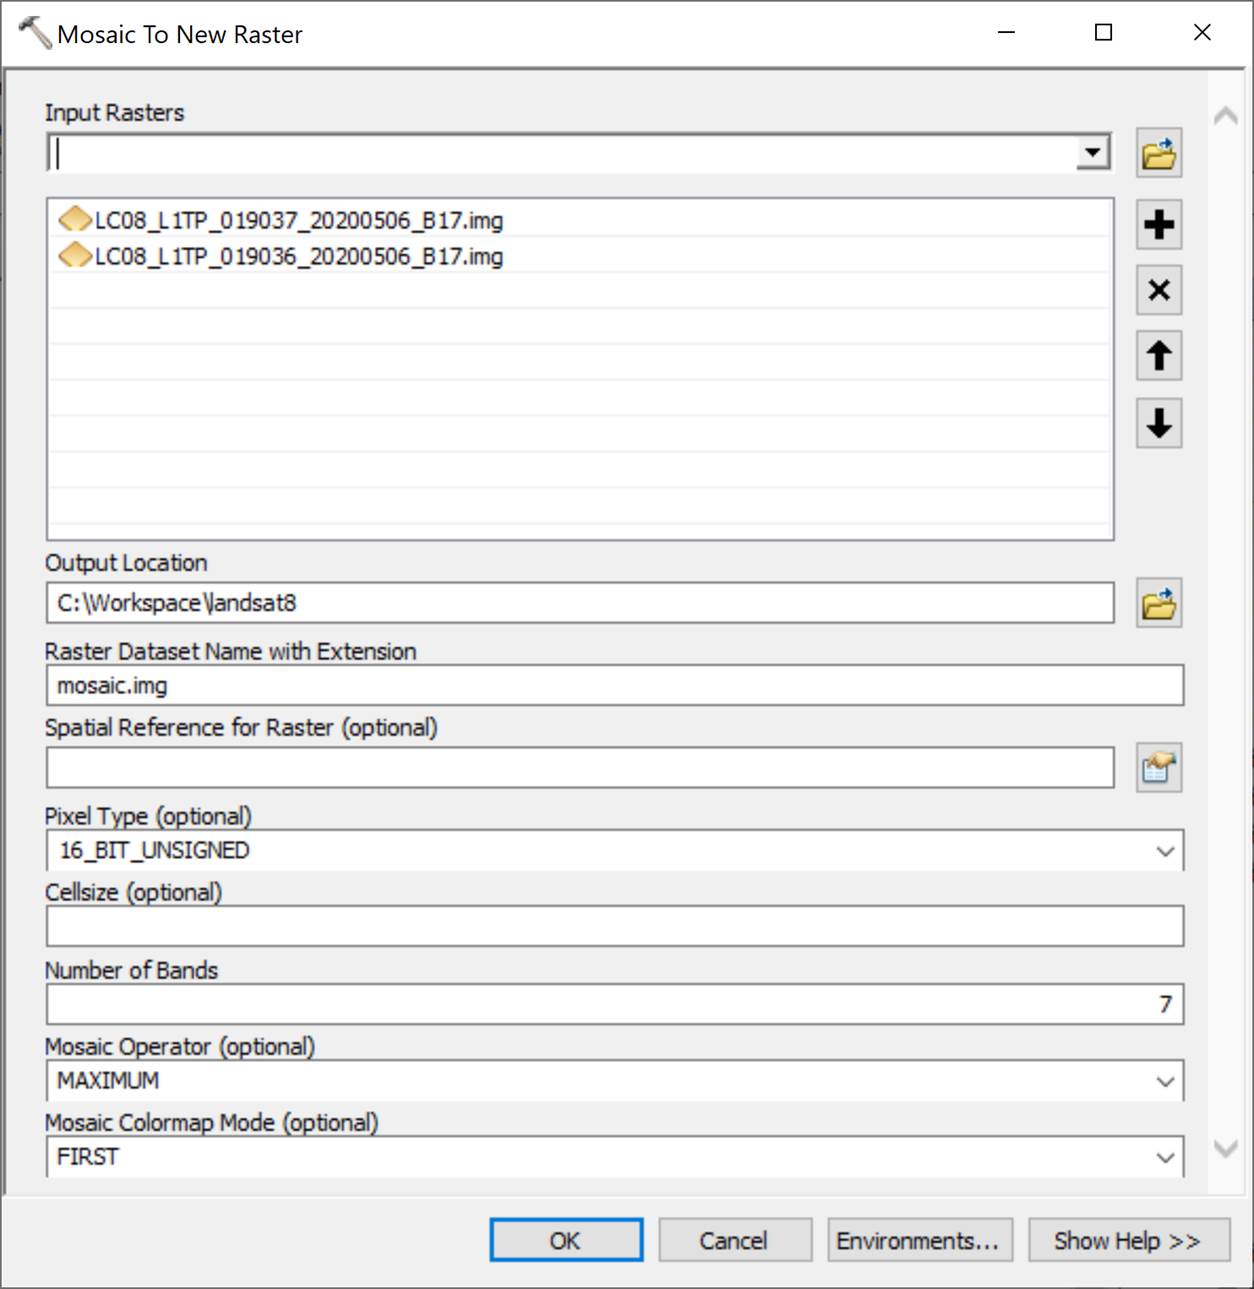
Figure 8. Mosaic to New Raster dialog box in ArcMap.
Clipping an Area
Clipping is also frequently used for preparing an image for further analyses. Depending on software packages, various tools and methods are available. In ArcMap, for example, the “Clip” tool is available in ArcToolbox à Data Management Tools à Raster à Raster Processing. Figures 9 and 10 show the mosaic and clip results.
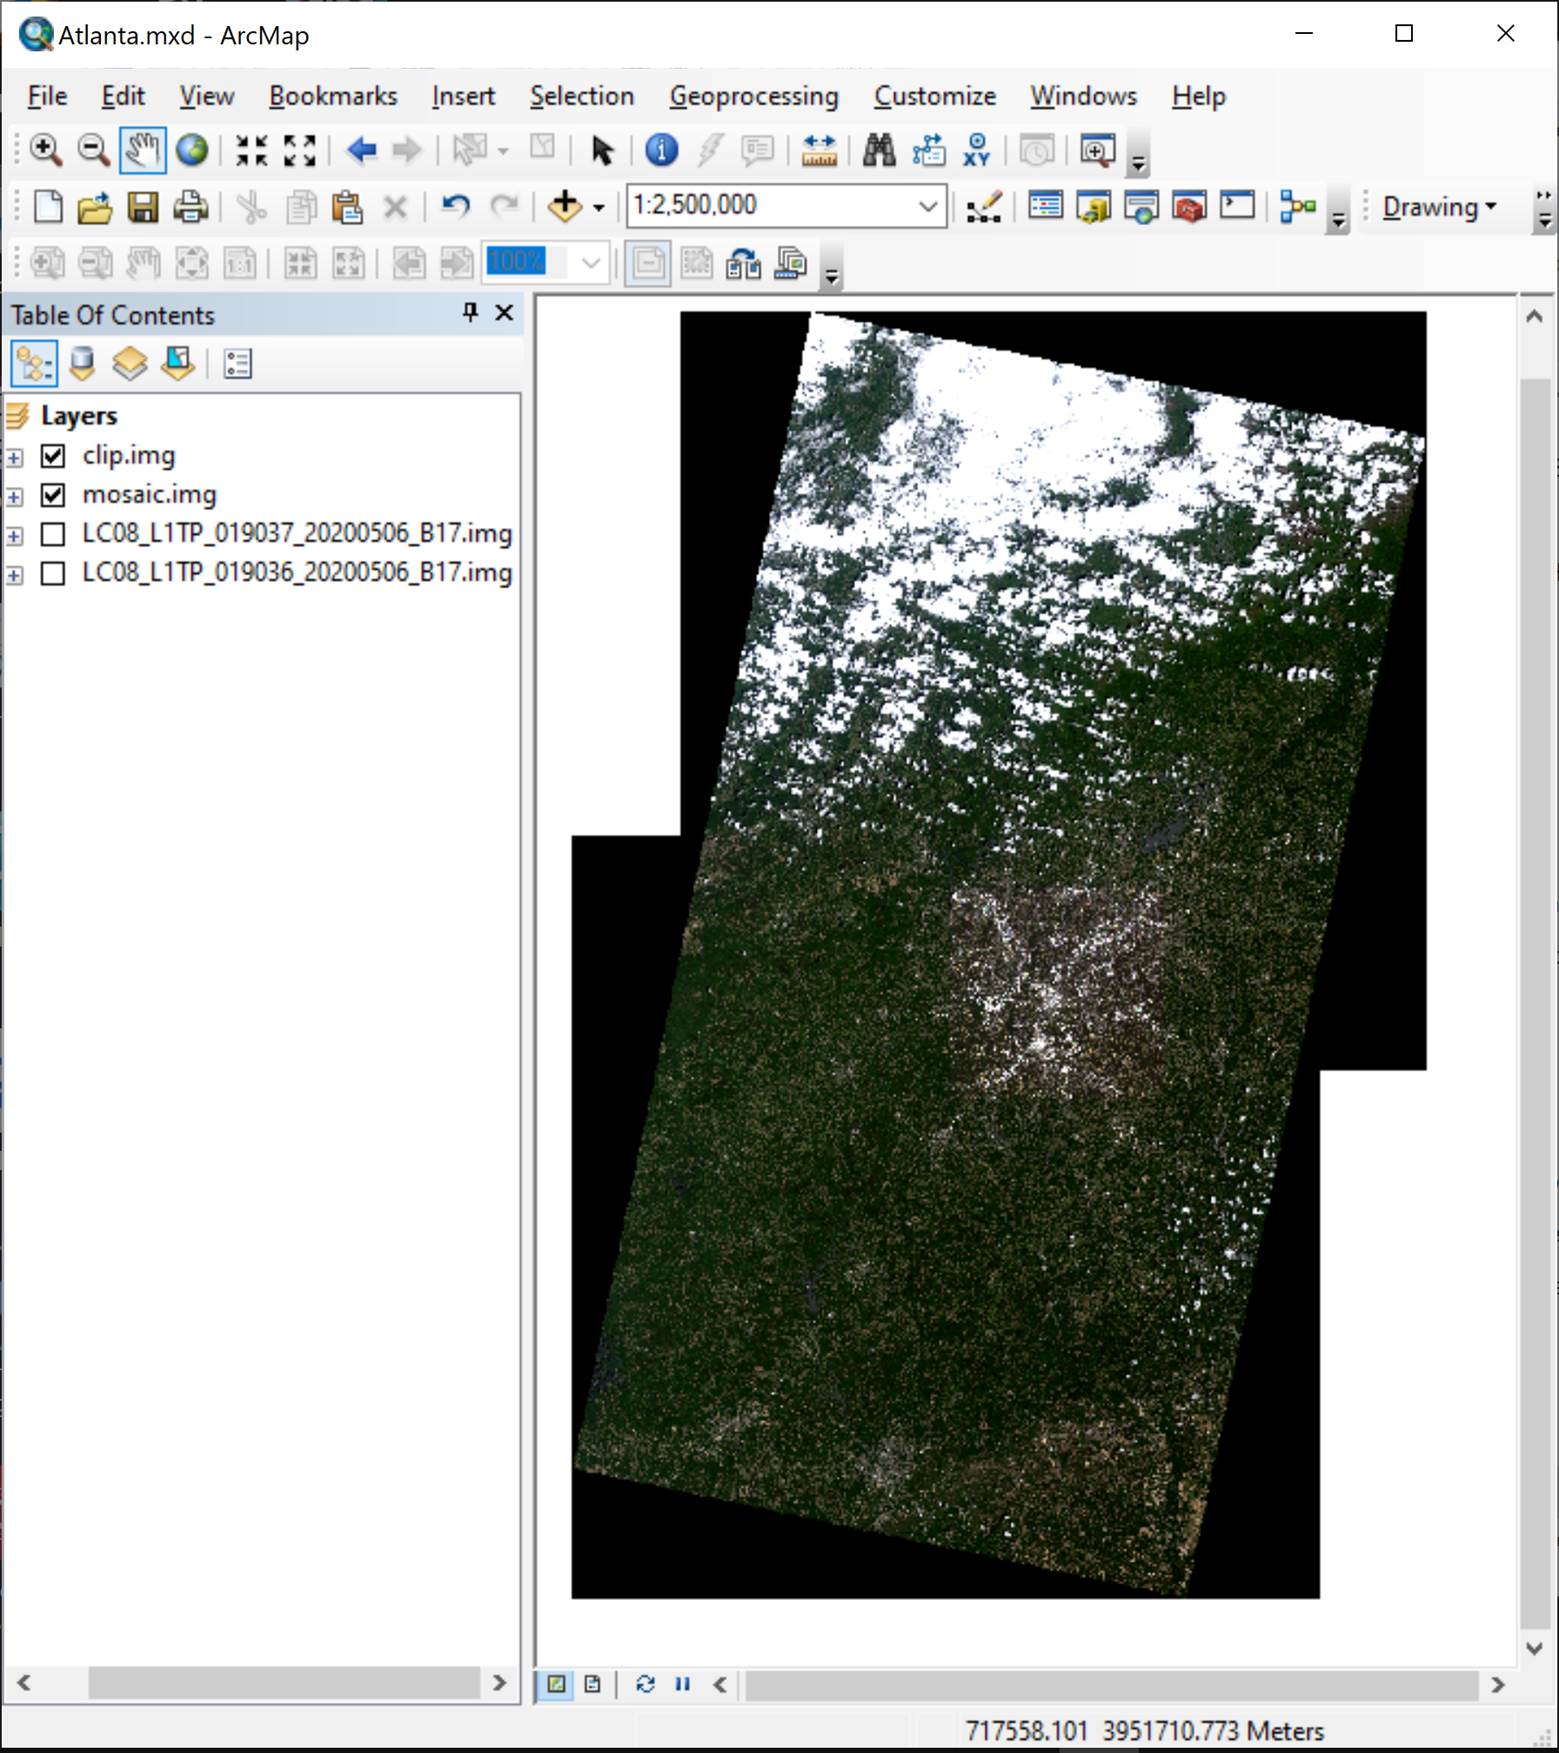
Figure 9. The results of mosaic and clip in ArcMap.
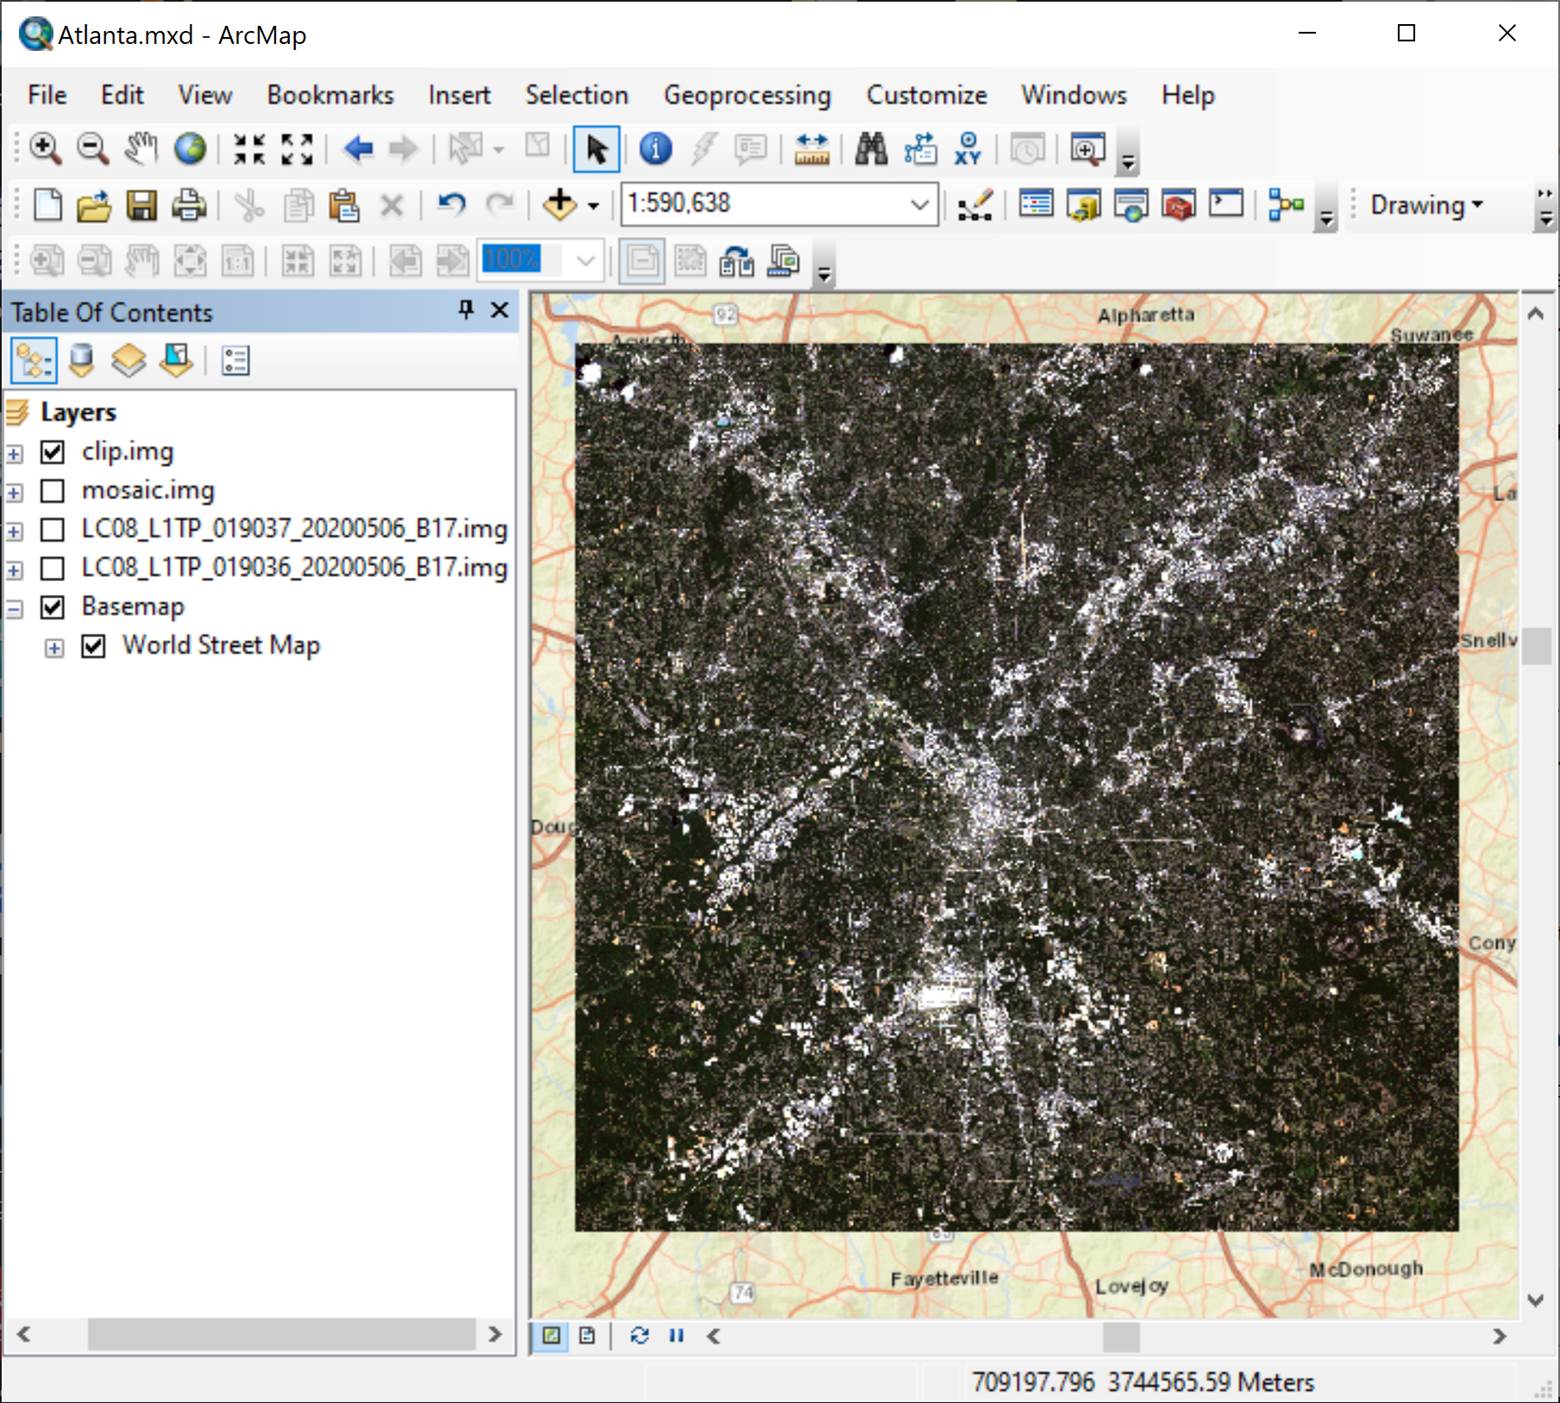
Figure 10. A zoom-in image of the rectangular clip area.
References
USGS, 2019. Landsat 8 (L8) Data Users Handbook. URL: https://prd-wret.s3.us-west-2.amazonaws.com/assets/palladium/production/atoms/files/LSDS-1574_L8_Data_Users_Handbook-v5.0.pdf