Chapter Contents
Measurement with Aerial Photos
Introduction to Aerial Photos
Aerial photos are the photographic images taken above the ground. Photos are frequently taken from low altitude for detailed information, but they are also frequently taken from high altitude to cover a larger area. Figure 1 shows an aerial photo taken from an airplane.
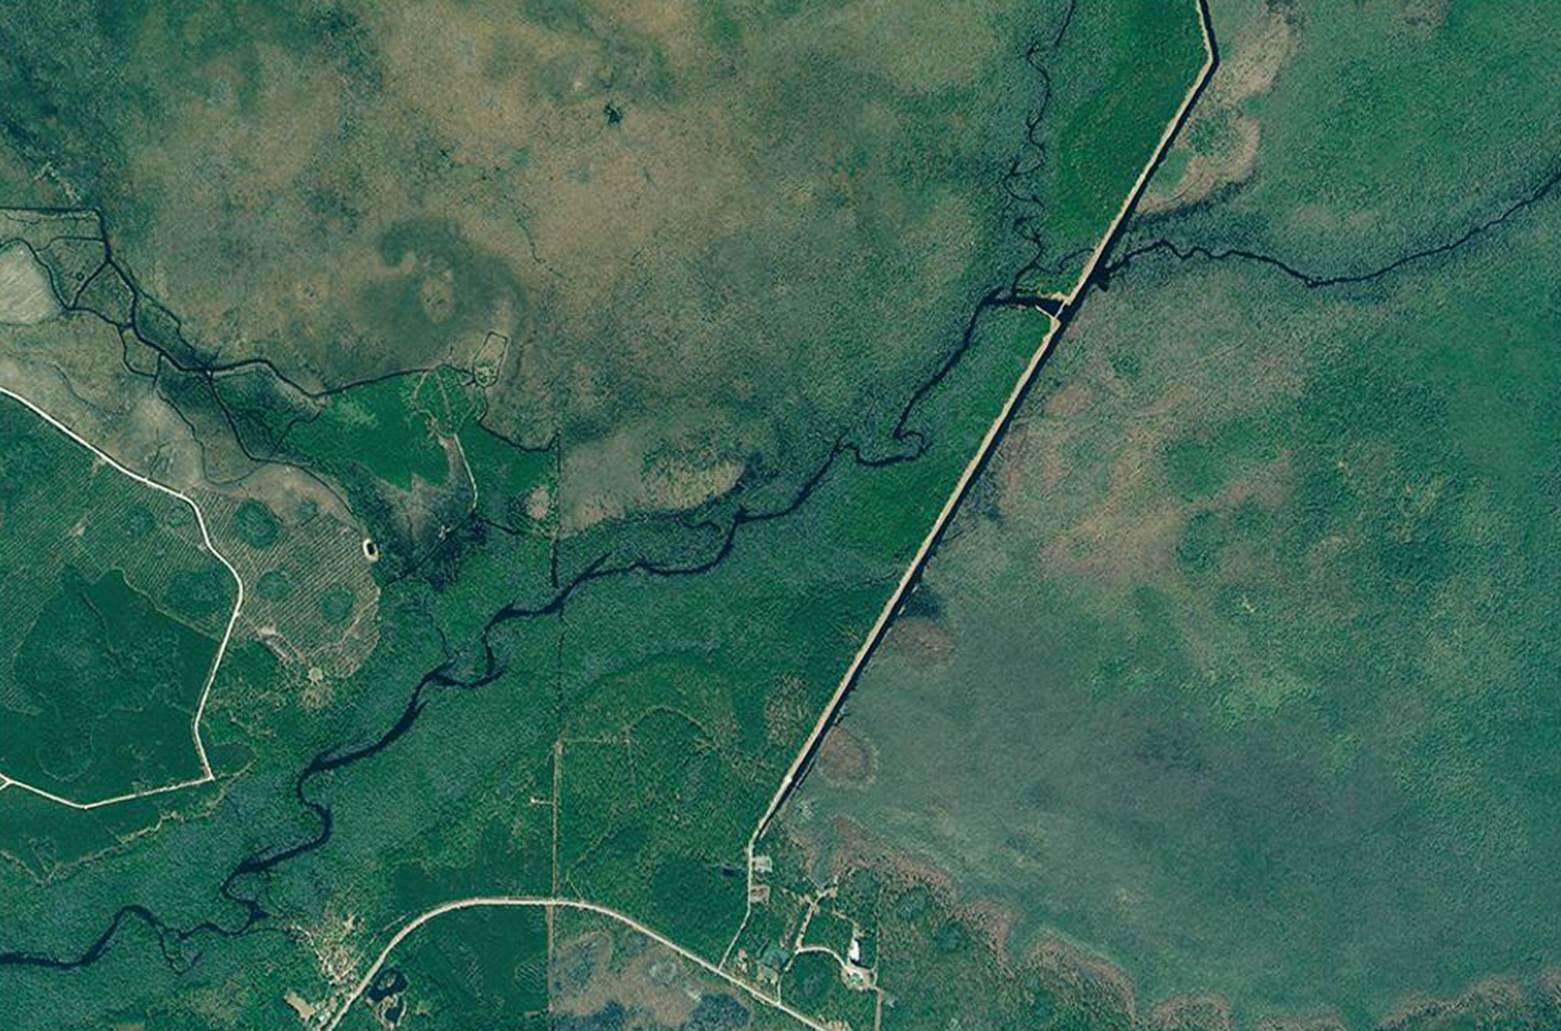
Figure 1. A digital airphoto. (The Okefenokee Swamp and the Suwanee River, Georgia. April 2010).
Aerial photos are used in many applications. For example, air photos have been the source of national topographic maps. Contour lines and man-made features have been delineated from aerial photos. They have also been the source of military target monitoring, land-use change analysis, photogrammetric measurements, stereoscopic view, and the backdrop digital maps of most geographic information systems. Air photos also support engineering projects and environmental assessments.
Aerial Cameras
To take aerial photos, professional and calibrated cameras are frequently used. Typically, the 9”-by-9” films were used and they were organized in rolls. Recently, with the digital revolution, digital cameras have replaced film cameras. Most digital cameras are like film cameras in terms of their geometry. Figure 2 shows the geometry of a camera.
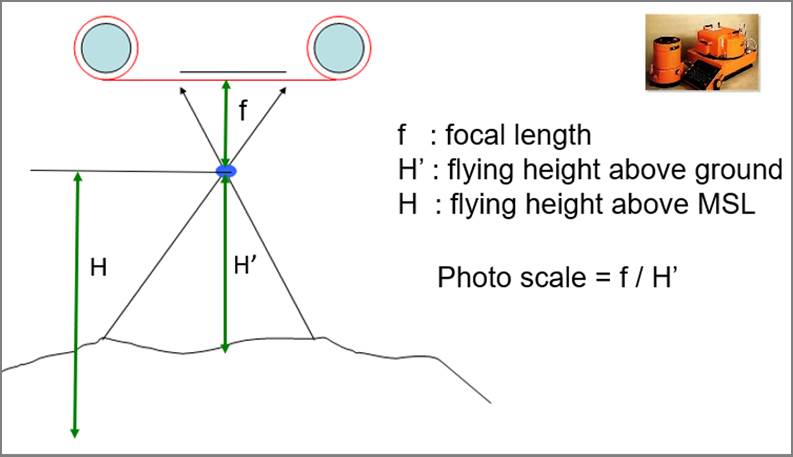
Figure 2. Aerial camera and geometry.
Focal length means the distance from the middle of the camera lens to the focal plane (i.e. the film or a CCD sensor array). As focal length increases, image distortion decreases. The focal length is precisely measured when the camera is calibrated.
Photo scale is the ratio of the distance between two points on a photo to the actual distance between the same two points on the ground. It can be calculated in many ways. One example is to divide the focal length by the flying height above the ground.
For example, suppose a photo that was taken at the flying height of 3000 feet above ground with a 152mm focal length camera. The photo scale is 152mm divided by 3000 feet. Because one foot is 0.3048m, or 304.8mm, the photo scale is 152mm divided by [3000 x 304.8mm], of which fraction is 1 / 6016. Therefore, the photo scale is 1 : 6016.
Vertical Aerial Photos
Most aerial photos are taken by directly looking down the ground. Those are vertical aerial photos, as shown in Figure 3. Because it is very difficult to achieve the exact 90 degrees, about 3 degrees of difference is allowed so that vertical aerial photos have about 87 - 93 view angles.
Oblique and ground photos are taken frequently too. Especially, oblique aerial photos cover relatively larger areas than vertical photos. Oblique photos are frequently used to take the images of inaccessible areas such as military targets.
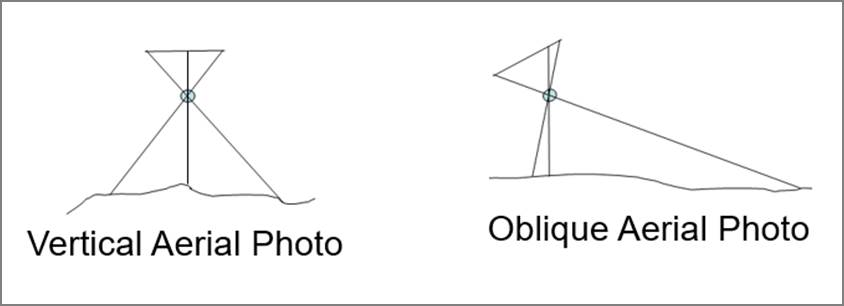
Figure 3. Vertical and oblique aerial photos
Films or Sensors
Most airphoto missions have been performed using black and white (B/W), color, or color-infrared (CIR) films or sensors.
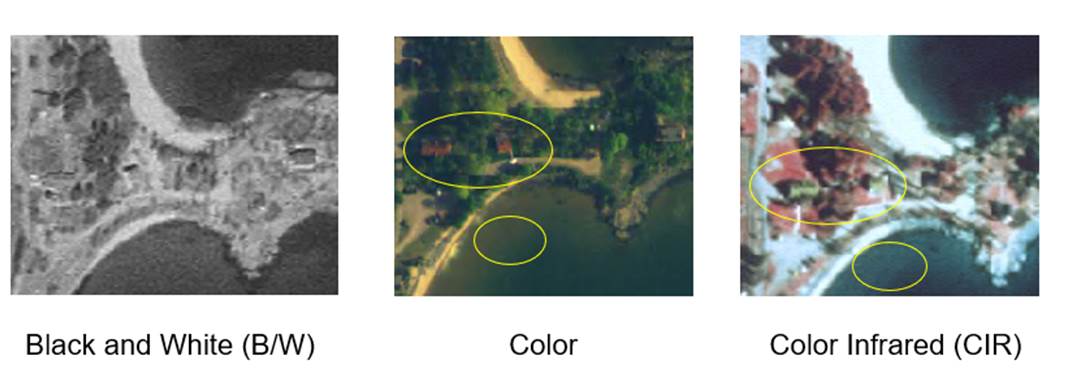
Figure 4. The B/W, color, and CIR photos of the same area (Presque Isle, Marquette, Michigan)
Black and white films/sensors cover the visible wavelength area in the spectrum, so it is frequently called “panchromatic.” The term, “pan-”, means “all” or “covering all of a region”. “Chroma” means “color.” Therefore, “panchromatic” means covering all the color regions of a spectrum in one band. The panchromatic images identify objects using brightness levels.
Color films/sensors record red, green, and blue bands, and the real color images are created by compositing the three primary colors.
In the case of color infrared films/sensors, infrared, red, and green band energies are recorded, and they are represented in red, green, and blue colors, respectively. Because the blue band energy is not recorded, blue objects are represented as black. As shown in Figure 4, a red-painted roof is represented as green in the CIR image. Also, the greenish water bodies appear in blue tones in the CIR. Likewise, blueish water bodies will appear as dark black in the CIR image.
Recently, with digital revolution, various devices are also used for aerial imaging such as thermal, hyperspectral, and LiDAR sensors. Also, many digital imaging sensors capture four bands: blue, green, red, and infrared, so that color and CIR photos can be easily composited from the four bands.
Forward Motion Compensation
When an image is taken on an airplane, the forward motion of the aircraft at the time of photo exposure leads to a dragging of the recorded image. This dragging is greatest in aerial photography at low altitude, high speed, and long exposure times. The dragging results in blurring in aerial photos.
Forward Motion Compensation is a technology that moves the camera during the photo exposure in order to compensate for the forward movement of the aircraft, thus eliminating drag from the recorded image. Sharper images can be obtained with the forward motion compensation.
In photography, motion compensation is needed to image an object sharply when the object and a camera are moving asynchronously. In the case of aerial photography, a camera moves along with an airplane; while in a sports event, for example, objects like an athletic, move. In both cases, objects can be pictured sharply by moving the camera slightly.
Airphoto Components
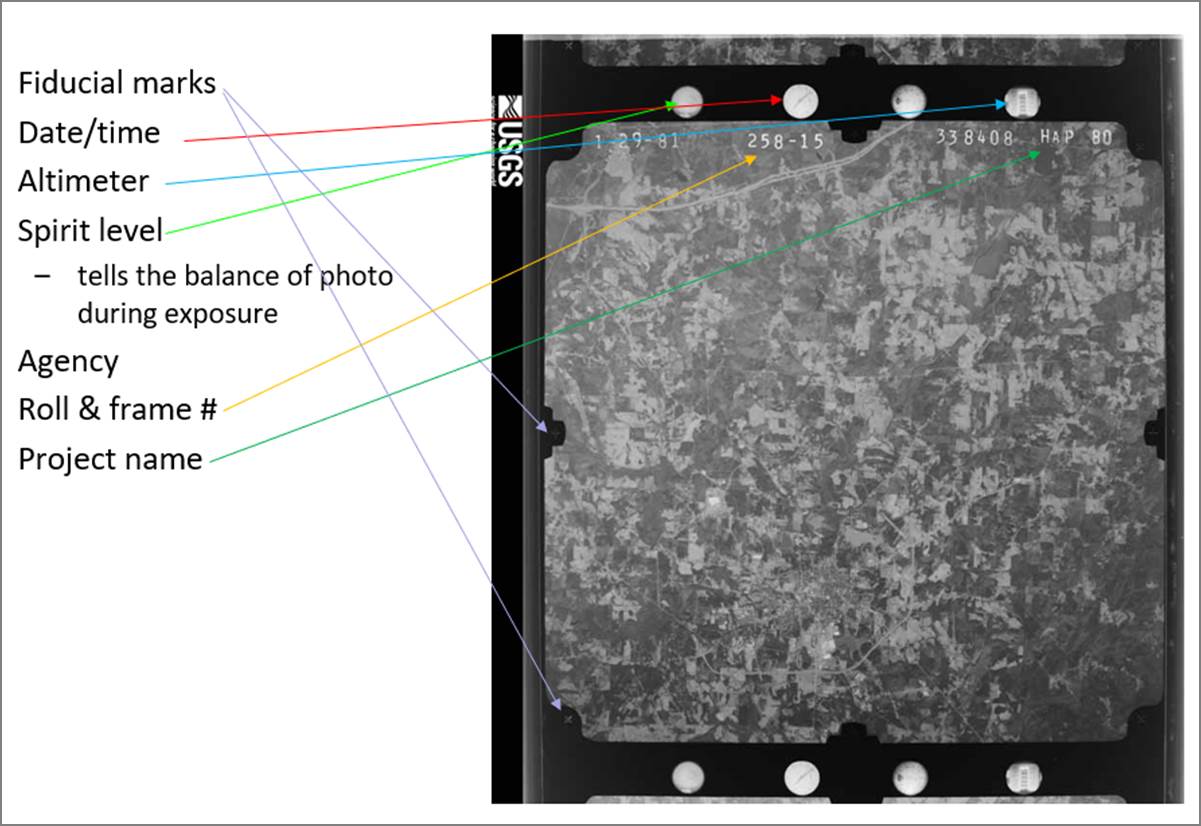
Figure 4. Components of a black/white aerial photo showing Carrollton, Georgia. (Photo by USGS)
An aerial photo contains various important metadata information. Fiducial marks are small registration marks exposed on the edges of a photograph. In Figure 4, we can see eight fiducial marks around the image. The distances between fiducial marks are precisely measured when a camera is calibrated, and this information is used by cartographers when measuring objects on the image. A clock indicates the time of day that the image was taken, usually in the Greenwich Mean Time. This can be useful in interpreting the image because the time of exposure can influence shadows on the image. An altimeter shows the altitude of the plane above sea level at the instant when the airphoto was taken. The altimeter information can be used to determine the photo scale. A spirit level is used to determine whether the camera was level to the ground at the instant the airphoto was taken. The spirit level also tells whether the photo is a vertical photo or not. The roll and frame counter identify the roll and frame numbers which can be used for sequencing images along the flight path.
Overlap and Sidelap
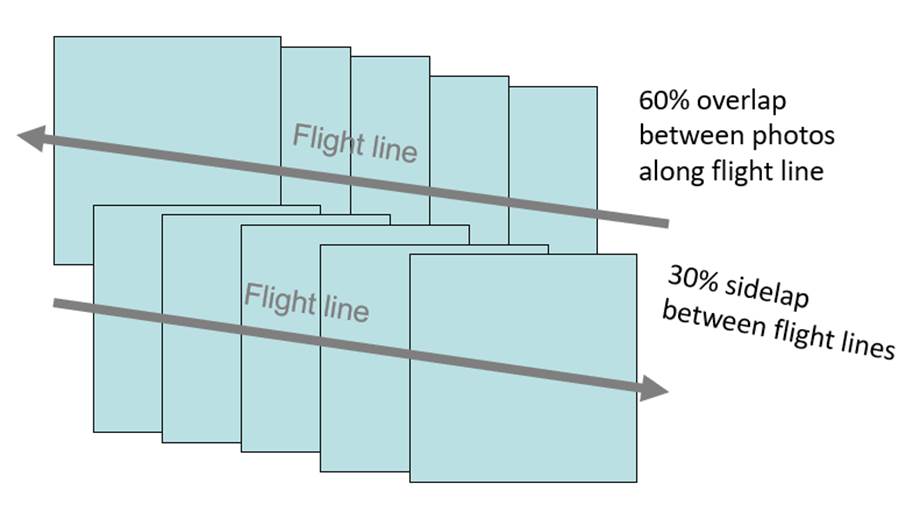
Figure 5. Overlap and sidelap.
As shown in Figure 5, overlap is the amount by which one photograph includes the area covered by another photograph. It is expressed as a percentage. Most photo survey projects are designed to acquire at least 60 percent forward overlap between photos along the same flight line, and 30 percent lateral overlap between photos on adjacent flight lines. The lateral overlap is called “sidelap.”
With the use of digital imaging systems, the overlap and the sidelap tend to increase. For example, drone imaging may use even 90% overlap and sidelap to improve 3-D modeling and post-processing accuracies.
Air-Base
As shown in Figure 6, the distance between two successive exposure stations is called “air-base.” Similar terminology is “eye-base,” which means the distance between two eye centers. The exposure station is the position of the front nodal point of the lens at the instant of exposure.
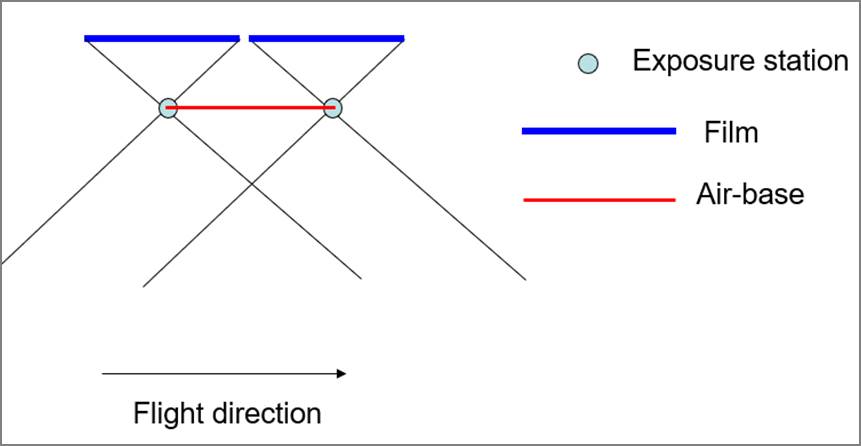
Figure 6. Air-base.
As the eye-base allows people to perceive the depth of objects, air-base allows building a 3-D model with overlapping photos. As the air-base increases, the exaggeration of objects along the Z-axis increases too.
Principal Point and Nadir Point
The intersection of the lines connecting fiducial marks is a principal point. A principal point is the central location of an air photo.
The nadir point is the intersection of the vertical plumb line through the center of the lens and the image plane. On a true vertical airphoto, the principal point and the nadir are the same point, but on an oblique airphoto they are at different positions on the image plane as shown in Figure 7.
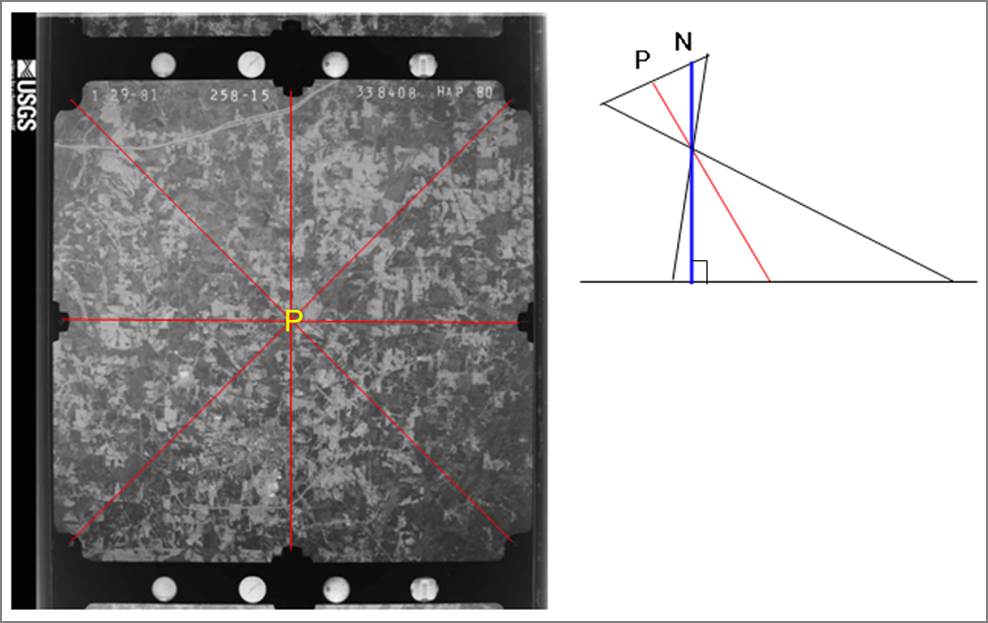
Figure 7. Principal point (P) and nadir point (N)
Digital Imaging
Digital Imaging Device Types
There are three types of digital imaging devices depending on how energy-sensing detectors are placed.
· Whiskbroom scanner: 0-D, single detector
· Push broom scanner: 1-D, linear array of detectors
· Virtual imaging camera: 2-D, rectangular array of detectors
First, whiskbroom scanners, a.k.a. spotlight or across-track scanners, use a rotating mirror that reflects energy to a single detector. Whiskbroom scanners have been used in the Landsat series satellites, particularly Landsat 1 through 7. Figure 8 shows the ETM+ (Enhanced Thematic Mapper Plus) sensor onboard Landsat 7. As shown in the image, the scan mirror makes 7 cycles per second and the visible bands (i.e. bands 1-4 and 8) are recorded by the silicon detectors on the primary focal plane. The other infrared (bands 5 and 7) and thermal infrared band (band 6) are detected by the detectors on the cold focal plane. The rotating mirror and satellite’s forward movement makes a scanning pattern on the ground like the trace of brooming with a whisk. Because whiskbroom scanners have moving parts, they are more likely to be expensive and to wear out.
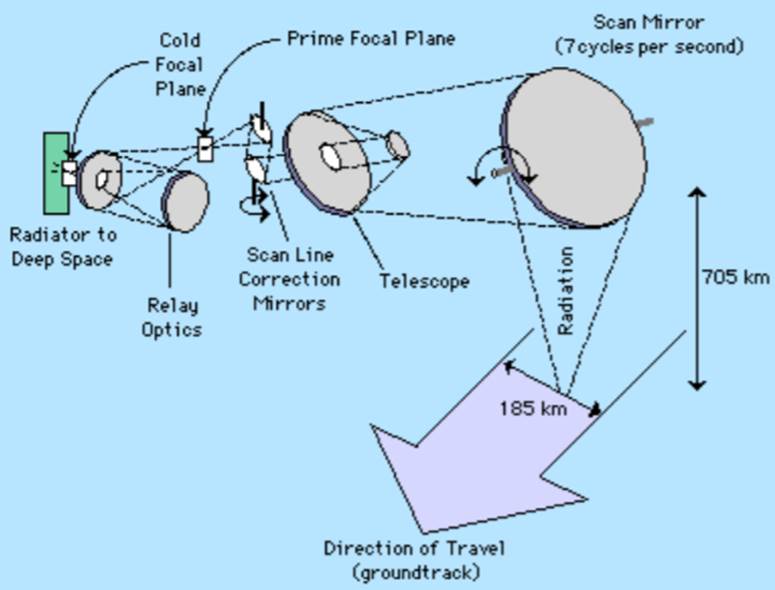
Figure 8. The ETM+ whiskbroom scanner onboard Landsat 8 (NASA, 2016)
Second, push broom scanners, a.k.a. along-track scanners, use a 1-D array (i.e. a line) of detectors arranged perpendicular to the flight direction. Figure 9 shows an example of the OLI (Operational Land Imager) linear sensor array onboard Landsat 8. In the figure, there are 14 identical sensor chip assemblies (SCA) arranged in an alternating pattern along the centerline of the focal plane. Each SCA contains 494 detectors with a nine-band filter assembly. Therefore, data are acquired from 6916 detectors for each spectral band. In the case of the panchromatic band, data acquisition is doubled, so that a total of 13,832 detectors are used along the line.
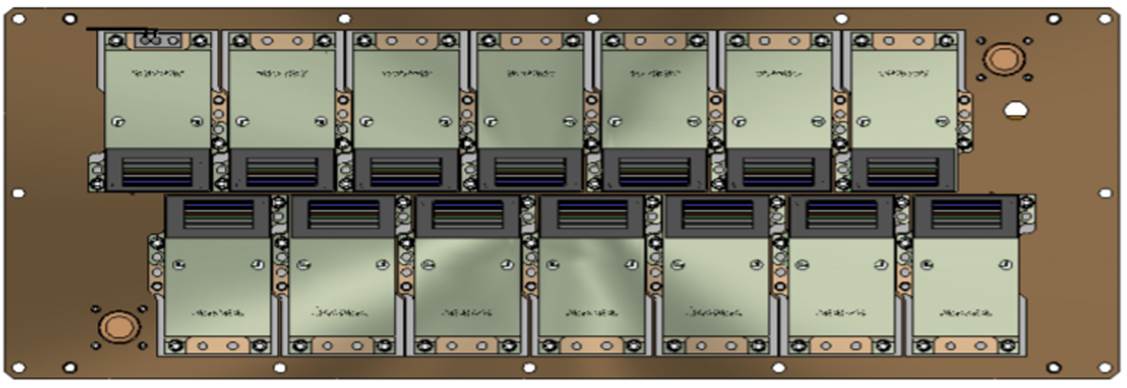
Figure 9. The OLI linear sensor array onboard Landsat 8 (USGS, 2019)
Third, virtual imaging cameras uses a 2-D array of detectors, as shown in Figure 10. It is like traditional film cameras, except using a 2-D array of detectors instead of film. Consumer digital cameras and cell phone cameras, for example, are virtual imaging cameras.
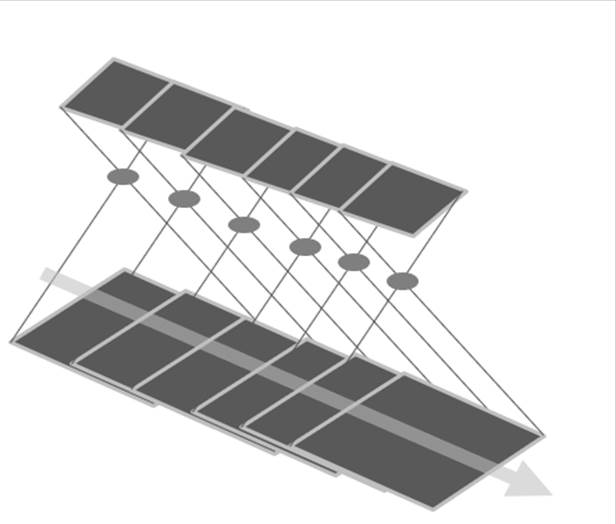
Figure 10. Imaging with a virtual imaging camera.
Increasing detectors requires more effort to calibrate and normalize them. When geometrical accuracy is considered, the image from a virtual imaging camera type will be the best when compared with the other imaging types.
Digital images frequently come with camera position values. Camera position values tell where the camera is located (i.e. X, Y and Z values) and what direction the camera is looking at (i.e. omega, phi and kappa values). In the case of push broom type scanners, imaging position is recorded line by line. For the virtual imaging type cameras, camera position is recorded frame by frame. The camera position information is very important for further processing of images.
The X, Y and, Z values are frequently obtained using the global navigation satellite systems like GPS (Global Positioning System). The omega, phi, and kappa indicate camera tilt, and they are frequently obtained using IMU (inertial measurement unit) with a gyroscope. The values are calculated in relation to the airplane or satellite’s flying direction. As shown in Figure 11, Omega is the amount of rotation about the x-axis. The x-axis, in aircraft, points along the velocity vector, i.e. towards the heading. Omega is caused by the rolling of an aircraft. Phi is the amount of rotation about the y-axis. The y-axis goes out to the right wing of the aircraft. Phi is caused by the pitch of an aircraft. Kappa is the amount of rotation about the z-axis. The z-axis goes out to the underside of the vehicle. Kappa is caused by the yaw of an aircraft. Strong head winds tend to cause pitch, and strong side wind brings yaw.
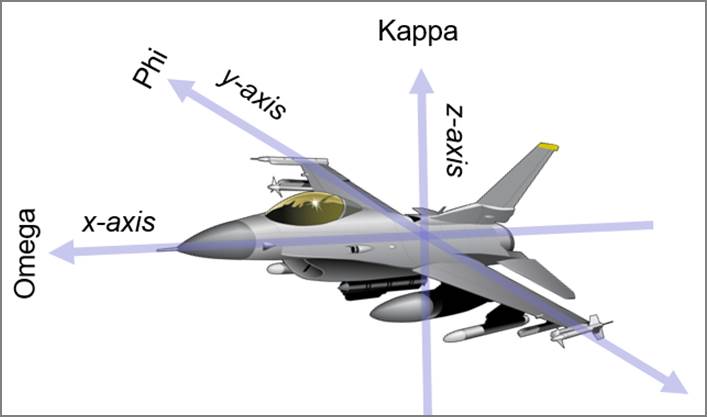
Figure 11. Omega, phi and kappa.
Orthophoto
Even though raw aerial photos deliver numerous information, orthophotos allows accurate measurements of points, lines, and polygons directly on them. They are photo maps so that they are used for the background of most GIS applications. They are created by removing the distortions of aerial photos.
Distortions in Aerial Photos
There are many distortions in raw aerial photos. Two typical distortions are the radial lens distortion and the relief displacement.
Figure 12 shows a radial lens distortion. As shown in the left image, ellipsoidal shapes of lenses cause radial distortions. Radial image distortions can be calibrated using precise lens parameters. The right image shows a corrected result.
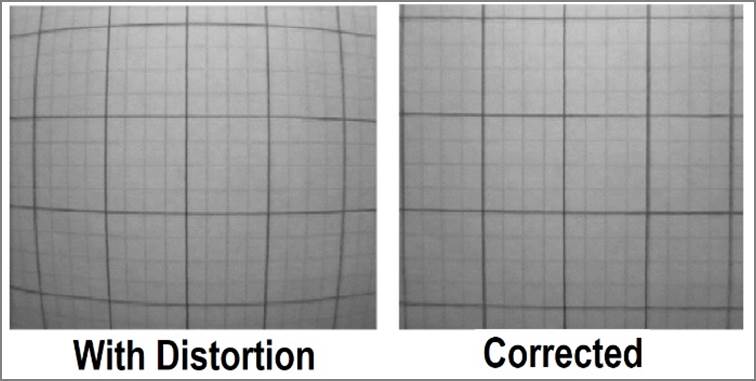
Figure 12. Radial lens distortion.
Another distortion frequent in aerial photos is relief displacement. Relief displacement is caused by the elevation change of objects. As shown in Figure 13, Points A and B are at the same X and Y coordinates on the ground, but different Z’s. When A and B are imaged on film, Point A is imaged farther away (A’) from the nadir point (N) than Point B (B’). The difference between Points A’ and B’ is called “relief displacement.”
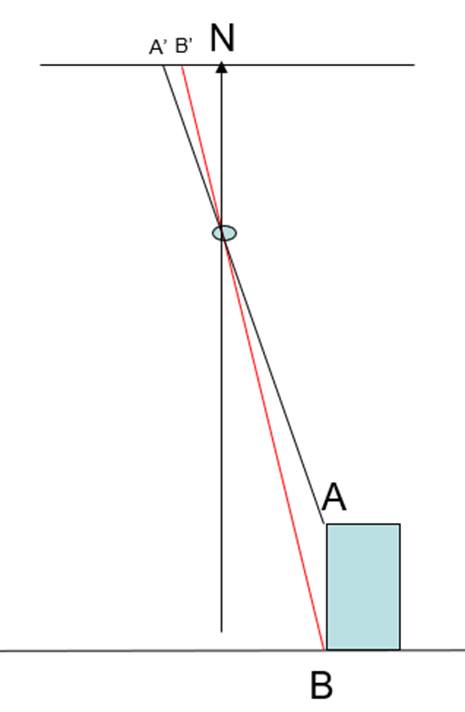
Figure 13. Relief displacement.
Relief displacement, on the other hand, delivers important information about object heights. By analyzing the relief displacement, air photo interpreters can measure object heights.
Orthophoto Creation
An orthophoto is created from a conventional perspective photograph so that image displacements caused by camera tilt and relief of terrain are removed. Figure 14 shows the perspective and orthographic views. Regular lens photos have the perspective view, while orthophotos have the orthographic view. The orthographic view is also used in maps. Measurement is correct on orthophotos, just like measurements on topographic maps.
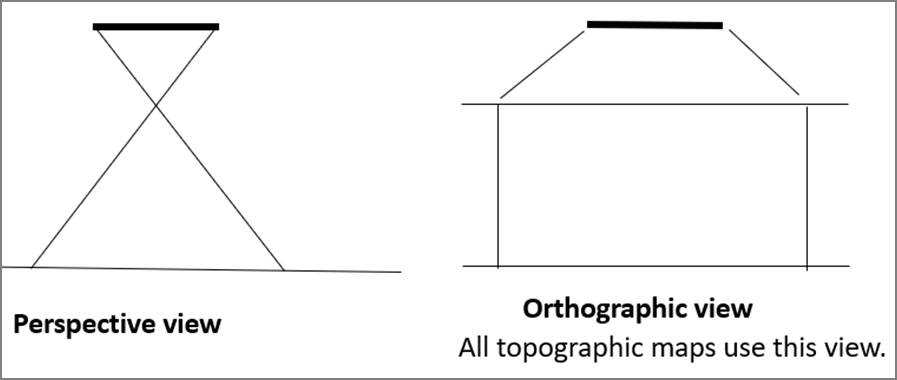
Figure 14. Perspective view vs. orthographic view.
To create orthophotos, relief displacement amounts need to be calculated at every pixel point with an accurate digital elevation model. Once displacement amounts are calculated, distorted pixel locations are adjusted accordingly as shown in Figure 15. In Figure 16, the left image is a regular aerial photo, and it shows a utility line running from the upper left corner to the lower right corner with relief displacements due to elevation changes. The right image is an orthophoto. It shows the same utility line running straight as indicated with red tinting.
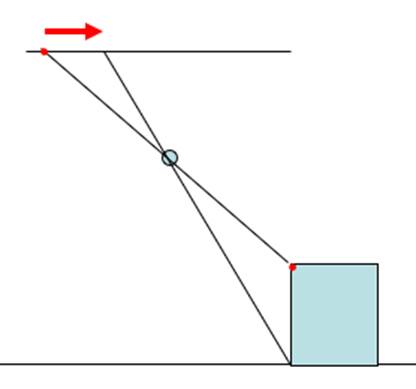
Figure 15. An adjustment of relief displacement using the building’s height information.
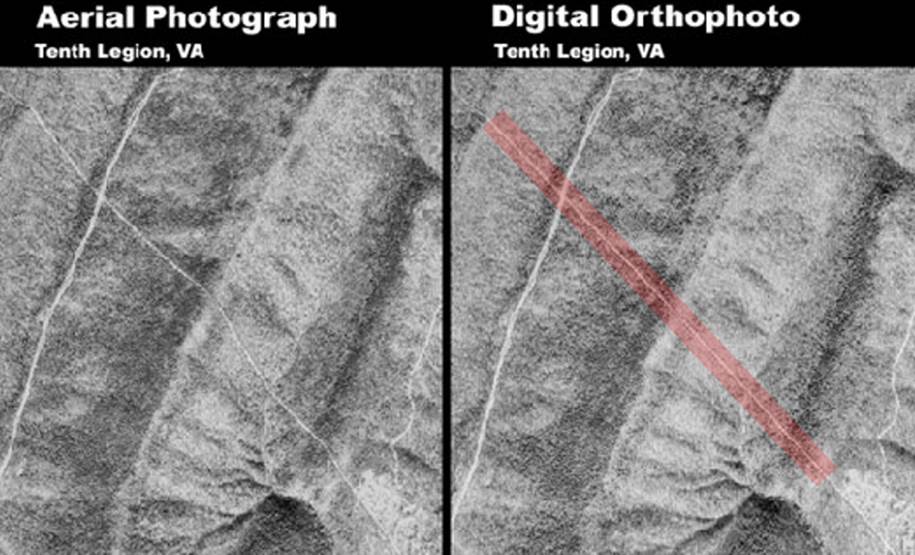
Figure 16. An aerial photo vs. an orthophoto. (USGS, 2020)
Measurement with Aerial Photos
Aerial photos allow us to measure object dimensions. This section will review some measurement techniques.
Distance Measurement
Distance measurement with an image is dependent on the photo scale. Photo scale can be calculated in many ways. One is to divide a photo distance by the ground distance. Another way is to divide the camera focal length by the height above ground.
Once the photo scale is calculated, ground distances can be calculated with a photo distance divided by the photo scale. For example, suppose an aerial photo with the following parameters:
· Distance on photo = 20.1 mm
· Focal length = 152 mm.
· Flying height above mean sea level = 5,000 m
· Mean terrain height = 1,200 m
The photo scale and the ground distance can be calculated as shown below. First, the photo scale is calculated with the focal length divided by the difference of the flying height above sea level and the mean terrain height. And then, the ground distance is calculated by multiplying the photo distance and the denominator of the photo scale.
· Photo scale = 0.152 m / (5,000 m – 1,200 m) = 1 / 25,000
· Ground Distance = 0.0201 m x 25,000 = 502.5 m
Area Measurement
A ground area is calculated with the photo area divided by the photo scale squared [Ground Area = Photo Area / Photo Scale2]. Suppose that the area of a lake is 42.3 cm2 on a 1:12,000 vertical photo. Then, the ground area will be 0.00423m2 x 12,0002, resulting in about 60.9 ha.
Height Measurement
Heights can be measured with relief displacement, flying height above ground, and radial distance from the principal point to the end point of the object. For example, if relief displacement, flying height, and radial distance are 2.01mm, 1220m, and 56.43mm, respectively, the object height is the product of 2.01mm x 1,220m / 56.43mm, which is 43.45m, as shown in Figure 17.
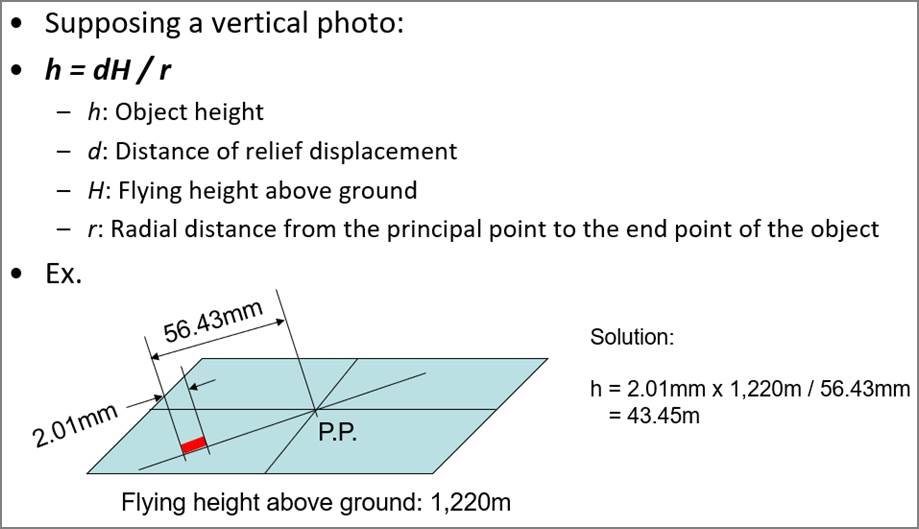
Figure 17. Measurement of an object height from a vertical aerial photo.
Measurement with Two Overlapping Photos
Two overlapping photos allow viewing objects in 3-D. Stereoscope, parallax bar and stereoplotter have traditionally been used to measure object dimensions as shown in Figure 18. A stereoscope is a binocular instrument for viewing stereo-image pairs, such that each eye sees only one of the pictures, producing a sensation of depth as is obtained with direct binocular vision. Parallax means the apparent displacement of the position of an object caused by a shift in the point of observation. A parallax bar measures the difference of parallax which allows calculation of an object height. A stereoplotter is an instrument for plotting a map or obtaining spatial solutions by observation of stereoscopic models, formed by stereopairs of photographs. It has been the primary method to plot contour lines on topographic maps since the 1930s. Although the specific devices have advanced technologically, they are all based on the apparent change in position of a feature in the two stereo photographs, which is parallax.
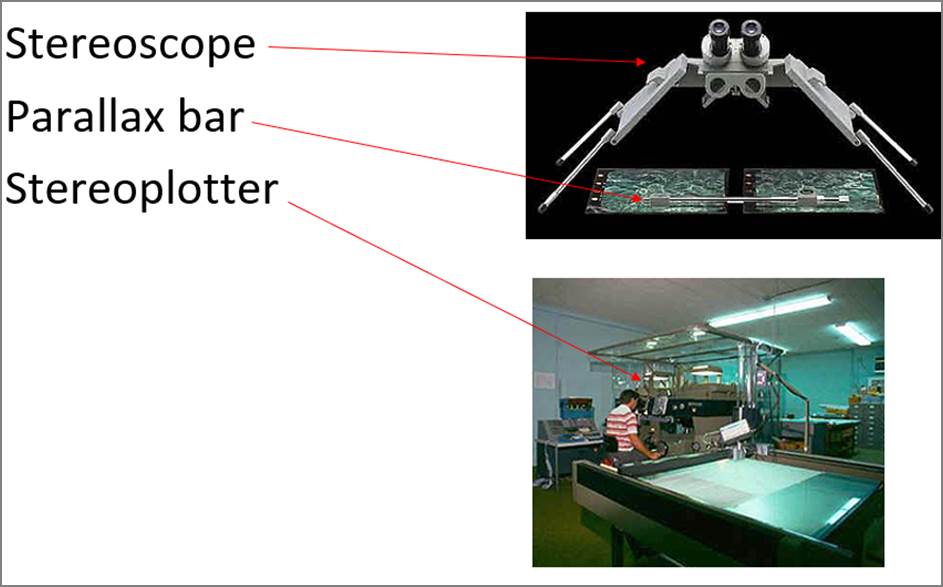
Figure 18. Traditional tools for 3-D viewing and measurements.
Measurement with Geospatial Information Systems
With digital revolution, various geospatial information systems like Google Earth Pro and Esri ArcGIS allow us to measure object coordinates and dimensions using on-screen digitizing. Figure 19, for example, shows measuring a distance in Esri ArcMap. Also, the status bar at the bottom of Figure 20 shows the geographic latitude and longitude coordinates and the elevation of the golden Georgia Dome in Google Earth Pro.
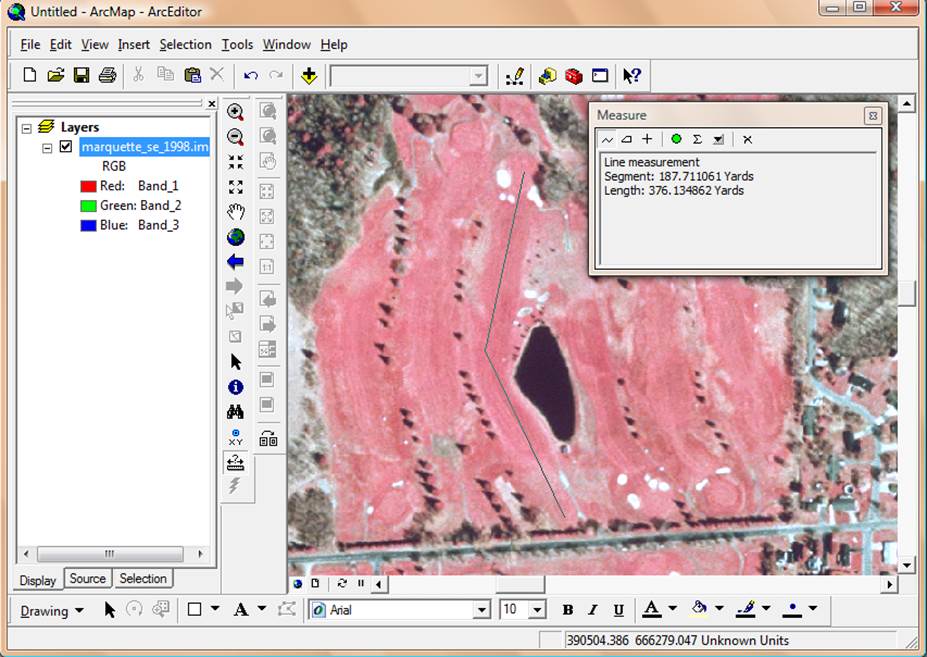
Figure 19. Distance measurement with a GIS tool (Esri ArcMap).
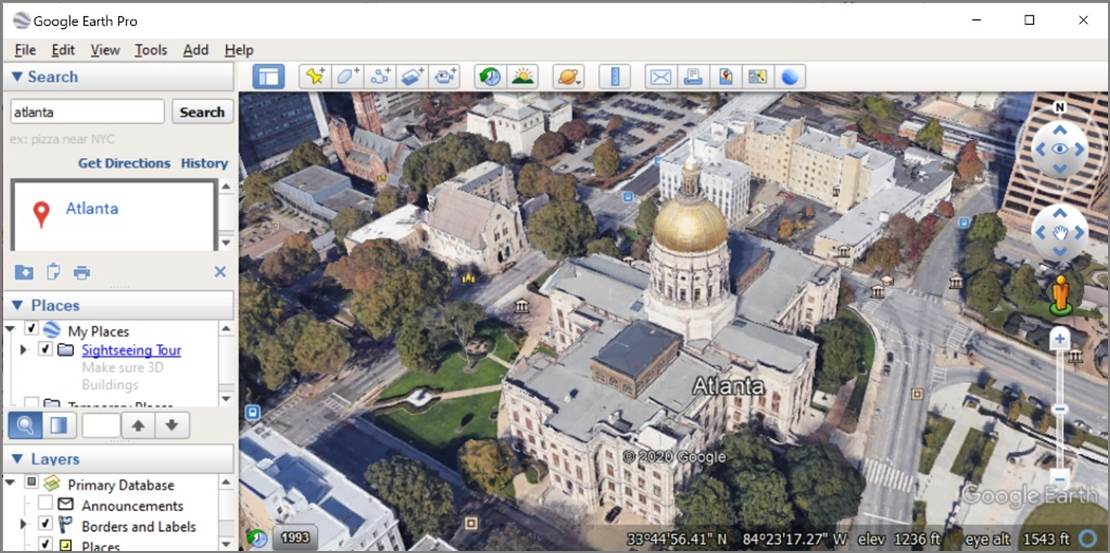
Figure 20. Google Earth Pro.
Flight Planning
Things to Consider
When taking aerial images, flight planning is very important. Taking aerial photos requires careful planning before a flight. Many things, as shown in Figure 21, should be checked when designing a flight plan.
The first thing to consider in flight planning is to include leaves or not. The decision is dependent on applications. If aerial photos are going to be used for county taxation or contour delineation, leaf-off images will be more useful. In the case of using aerial photos for forestry applications, leaf-on aerial photos will be also very useful.
The second thing to consider is film types or the bands to record. In the case of vegetation applications, for example, color infrared images may be more useful than color photos. Nowadays, most digital aerial cameras capture four bands (blue, green, red, and infrared) so that users may create black and white, color, or color infrared photos from the four bands easily.
The third thing to consider is the amount of shadow. Shadow itself frequently provides invaluable information such as object height. However, less shadow is preferred in most aerial photos because shadows block other features. Most aerial photography flight missions are performed between 10:00am and 2:00pm to avoid shadows.
The fourth thing to consider is the photo scale or the level of detail. The photo scale is determined by the detail that target applications need, and by the available resources. Increasing the level of detail would increase resources exponentially.
Finally, the weather condition is also important in flight planning. For example, it may not be appropriate to take images for soil moisture analysis right after raining.
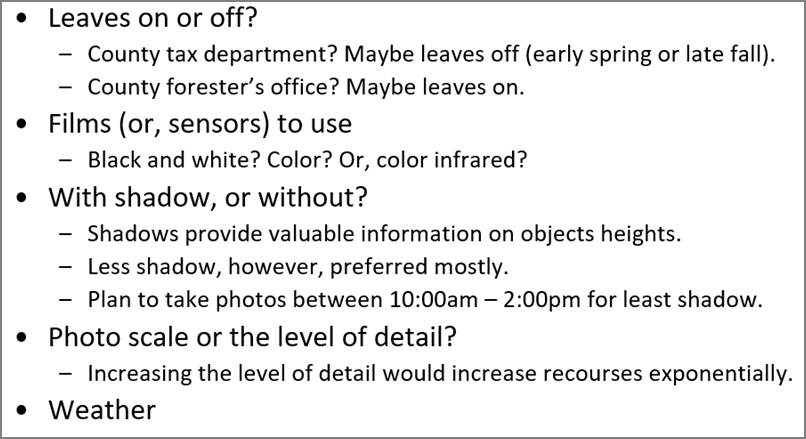
Figure 21. Things to consider in flight planning.
Flight Lines
One more thing to consider for flight planning is to make the least flight lines as shown in Figure 22. Supposing a survey area is like the cyan-color rectangle, the flight lines on the left-hand side are better than the flight lines on the right-hand side because they make fewer turns of aerial vehicles, saving time and resources. Flight line planning is nowadays performed dynamically in a geospatial information system. Figure 23 shows a drone flight plan with the Pix4D Capture application on a cellular phone.
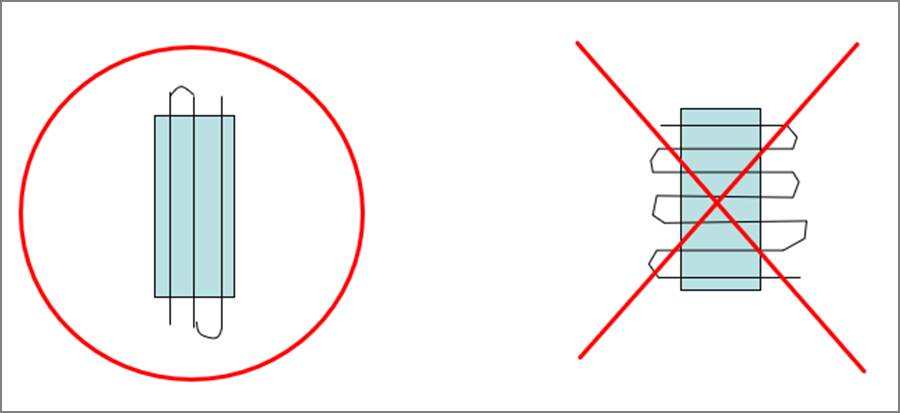
Figure 22. Designing flight lines. The left is better.
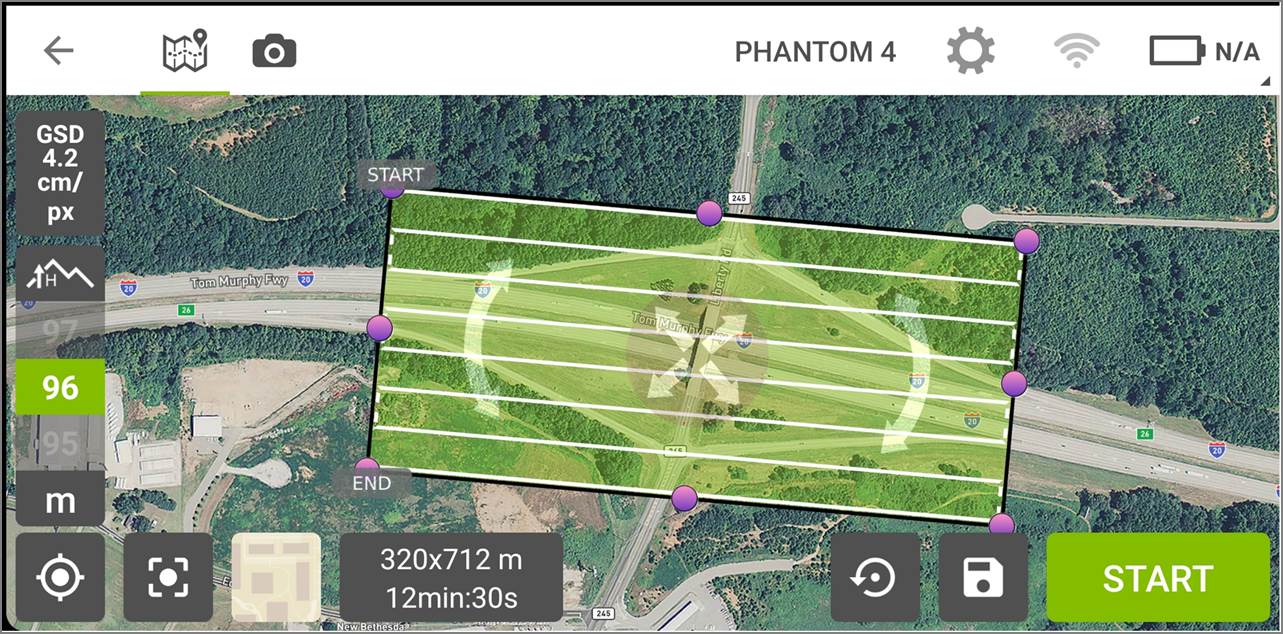
Figure 23. Flight line planning with the Pix4D Capture application on a cellular phone. Location: I-20 Exit 26 in Georgia.
References
NASA, 2016. Landsat 7 Science Data Users Handbook. https://landsat.gsfc.nasa.gov/wp-content/uploads/2016/08/Landsat7_Handbook.pdf
USGS, 2019. Landsat 8 (L8) Data Users Handbook. https://www.usgs.gov/media/files/landsat-8-data-users-handbook
USGS, 2020. What is a Digital Orthophoto Quadrangle (DOQ) or Orthoimage?, https://www.usgs.gov/faqs/what-a-digital-orthophoto-quadrangle-doq-or-orthoimage